Sea Eagle Management Scheme (SEMS) Review: Scheme Delivery 2020-2023
Summary
- Participation in the SEMS has increased from 102 holdings in 2020 to 184 holdings in 2023
- These holdings and their associated common grazings extend to over 185,000 hectares, with responsibility for over 78,500 breeding ewes and gimmers and 5,300 cattle.
- Participating holdings are concentrated in the west and north-west of Scotland with Argyll, Lochaber and Skye & Lochalsh accounting for 82% of holdings in the SEMS in 2023.
- In the period 2020-2023, NatureScot’s Call off Contractor team completed 118 new register of interest visits in addition to a wide range of fieldwork in order to investigate and mitigate sea eagle predation impacts.
- SEMS Management Agreement spend in the 2020-2023 period has increased from ~£190,000 to an estimated £315,000 in 2023.
- This period seen a revision to the SEMS, with the launch of enhanced and capital support, including the enhanced shepherding measure, with the number of holdings receiving enhanced support increasing year on year.
- A wide range of management, often tailored to individual management systems, has been supported in this period, with feedback on this new approach collated.
- There is wide-ranging lambing performance at SEMS holdings, reflecting the range of management systems, loss factors and scales of predation impacts and emphasising the importance of considering each holding on an individual basis when investigating and attempting to mitigate predation issues.
Introduction
The SEMS provides advice and support to farmers and crofters concerned about, or experiencing livestock predation by white-tailed eagles (WTE) or sea eagles, as they are often known.
It is widely acknowledged that in some places, WTE predate live, healthy lambs and the impact on farmers and crofters livelihoods can be significant. The issue of livestock loss is complex and the impacts extend beyond the direct loss of individual animals.
NatureScot, through the SEMS, is working closely with farmers, crofters, and a range of stakeholder partners to try to mitigate impacts where they occur. NatureScot run the SEMS on behalf of the National Sea Eagle Stakeholder Panel (NSESP), which is comprised of representatives from the following stakeholder organisations:
- NatureScot,
- National Farmers Union of Scotland
- National Sheep Association Scotland
- Scottish Crofting Federation
- Black-faced Sheep Breeders Association
- Royal Society for the Protection of Birds Scotland
- Forestry and Land Scotland
- Scottish Government Rural Payments and Inspections Division
- Scotland's Rural College
- Scottish Raptor Study Group
The SEMS is the main delivery mechanism for the White-Tailed Eagle Action Plan, with both being subject to a review in 2024. The most recent SEMS concluded in December 2023 and the purpose of this report is to provide stakeholders with an overview of the work delivered in the 2020-2023 SEMS, one of the key objectives of the 2024 review.
SEMS participation and expenditure
There is a range of different support offered by the SEMS, which includes advice from the NatureScot call off contractor team, loan of scaring equipment, and financial support in the form of Management Agreements (MAs).
The submission of a Register of Interest (RoI) is usually the first step for those wishing to participate in the SEMS. The submission of a RoI prompts a visit from one of NatureScot’s call off contractor team, who will discuss issues in more detail and gain a better understanding of the farmer or crofter’s management system.
In the period 2020-2023, the call off contractor team responded to 118 new RoIs in the SEMS, with Figure 1 below providing an overview of the numbers of new RoIs in individual years in the period:
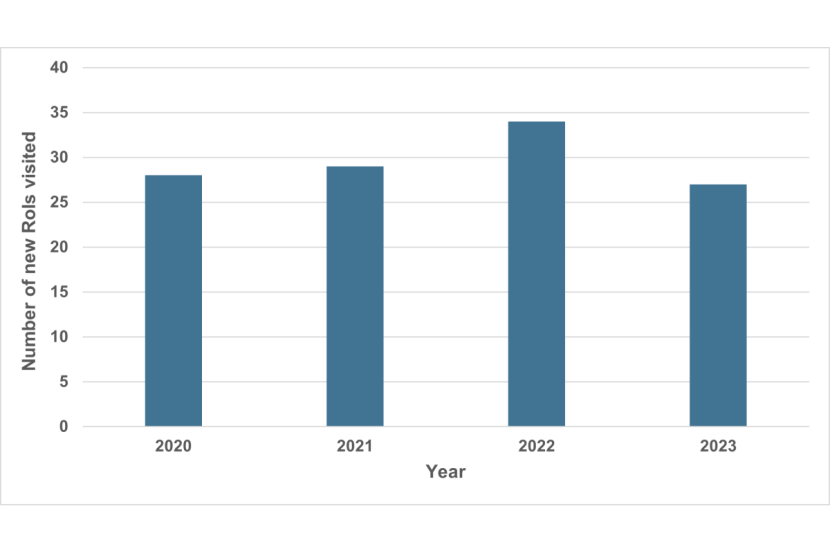
Figure 1: Number of new Register of Interest site visits by Call off Contractor Team 2020-2023
New RoI visits in individual years in the period ranged between 27 and 34. In addition to this work, call off contractor and NatureScot scheme staff were in regular liaison with a number of SEMS participants, including site visits and fieldwork at monitor farm sites, which are considered later in this report.
Following a call off contractor site visit, there is usually a follow up discussion with the SEMS manager. In the majority of cases, an application to the SEMS, for support in the form of a NatureScot MA follows. Figure 2 below, provides an overview of the number of holdings receiving MA support from the SEMS in the period 2020-2023.
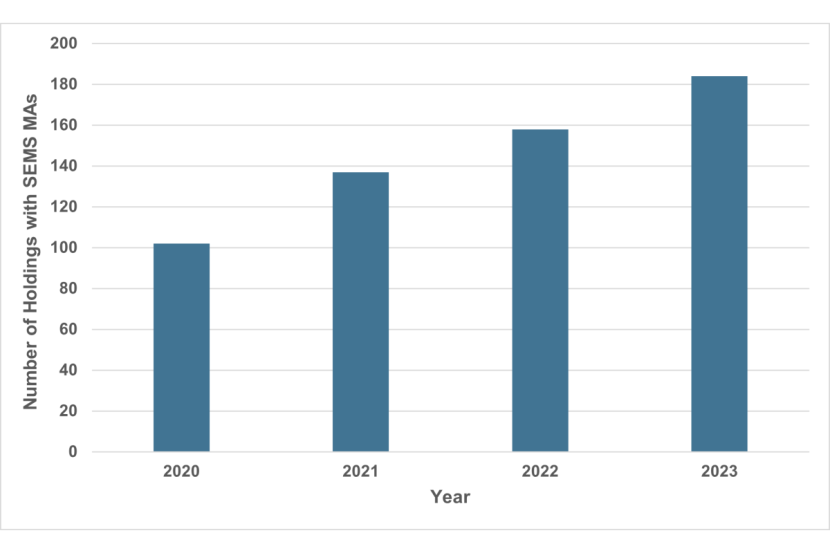
Figure 2: Number of holdings receiving SEMS MA support 2020-2023
Figure 2 highlights the year on year increase in the number of holdings receiving SEMS MA support in the period 2020-2023, with the largest increase in participation (35 holdings) evident between 2020 and 2021.
Greater awareness of the SEMS revisions made in 2020 and the SEMS being more flexible than the area-based support offered pre-2020, could explain the increase in this period.
The expanding nature of the sea eagle population, the concentration of the population in areas where sheep management is a primary land use, alongside greater awareness of the SEMS, are all likely key factors to explain the overall year on year increase in the number of holdings receiving SEMS MA support.
In order to provide geographical context to the numbers detailed in Figure 2 above, the locations of holdings and any associated common grazings, receiving SEMS MA support were mapped and are detailed in Figure 3 below.
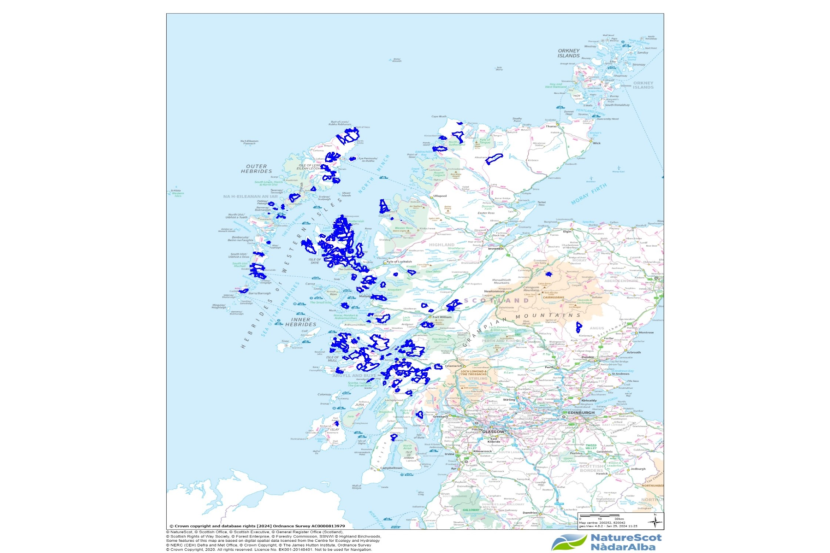
Figure 3: Location of holdings and associated common grazings receiving SEMS MA support 2020-2023
Figure 3 highlights that the majority of holdings receiving SEMS MA support in the period 2020-2023, were located in the west and north-west of Scotland, principally Argyll, Skye and Lochalsh and to a lesser, but growing extent, the Western Isles. This is to be expected, as this is where the Scottish sea eagle population is concentrated and agriculture, particularly sheep management, is a primary land use.
The holdings mapped in Figure 3 and their associated common grazings, where relevant, extend to over 185,000 hectares, with responsibility for over 78,500 breeding ewes and gimmers and 5,300 cattle.
Figure 4 below details the number of holdings receiving MA support in each individual year in the period by their location:
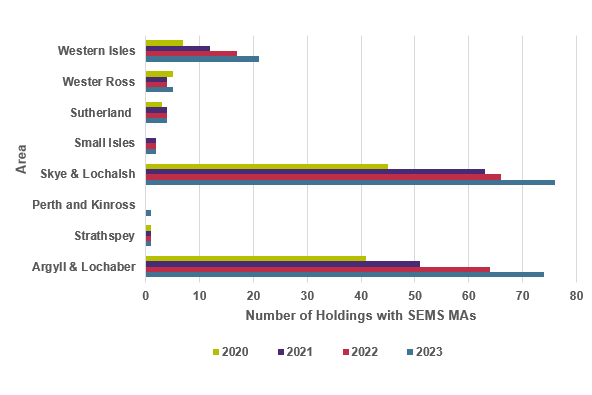
Figure 4: Number of holdings with SEMS MA by location and year in the period 2020-2023
Figure 4 highlights that the majority of holdings receiving SEMS MA support in the 2020-2023 period were in the Skye & Lochalsh and Argyll & Lochaber areas. The number of holdings receiving SEMS MA support in these areas also increased every year in the 2020-2023 period.
Figure 4 also highlights the trebling of holdings in the Western Isles receiving SEMS MA support from seven in 2020, to twenty-one in 2023. In order to address the increased reporting of predation issues and interest in the SEMS in the Western Isles, NatureScot contracted a call off contractor to cover this area in 2021.
The increase in the number of holdings receiving SEMS MA support in the 2020-2023 period is reflected in the increased budget of the NatureScot Sea Eagle Project and increases in underlying SEMS MA expenditure, detailed in Figure 5 below.
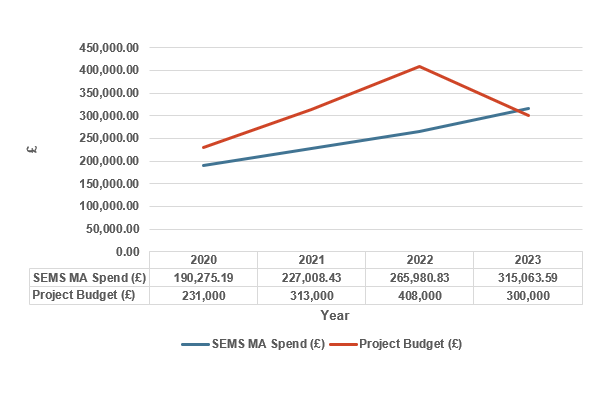
Figure 5: SEMS MA spend and Sea Eagle Project budget 2020-2023
Figure 5 highlights the increase in MA expenditure over the period 2020-2023. Figure 5 also highlights the increase in the Sea Eagle Project budget in the period 2020-2022.
In the 2022/2023 financial year, 30% of 2023 annual MA support was paid in order to take advantage of available budget and reduce financial resource requirements on the Project budget in the 2023/2024 financial year. This explains the decline in the Project budget in 2023 in Figure 5.
In addition to the increase in the number of holdings receiving support from SEMS MAs in the period 2020-2023, the increase in MA expenditure can also be explained by the revisions made to the SEMS in 2020.
Following discussion and consultation with the NSESP and local sea eagle stakeholder groups, the SEMS was significantly revised in 2020. The revisions made included a minimum £500 payment for smaller holdings and new enhanced and capital measures support, with associated increased support levels.
The SEMS has provided a range of enhanced and capital measures support to farmers and crofters in the 2020-2023 period, which are considered in further detail, alongside collated feedback from farmers and crofters on this new approach.
Enhanced and capital support
Enhanced support was targeted at holdings where sea eagle predation was considered most significant and holdings that had made significant management changes in order to mitigate sea eagle predation. In addition, support for enhanced shepherding – a new measure launched in 2020 - was targeted at holdings running extensive hefted hill flocks.
A wide range of measures was supported under the enhanced tier of the revised SEMS, which has a cap of £5000 per annum. The support offered was influenced by conversations between farmers and crofters and the call off contractor team and SEMS staff.
Enhanced support included contributions towards costs associated with indoor or in-bye lambing, in-bye retention of ewes, liming of in-bye and away wintering of ewes, as well as the previously mentioned enhanced shepherding measure. Support for new approaches proposed by farmers and crofters such as sponging of ewes for a tighter lambing window and trials of lambing jackets were also supported in this period, with feedback collated.
Enhanced MAs were often tailored to individual farmer and crofter’s management systems, requiring close communication between NatureScot and farmers and crofters, with this revised approach providing greater flexibility and support than the previous area based SEMS. This was reflected in some of the feedback from farmers and crofters on the new enhanced support level, with the collated feedback accompanying this report.
Capital MA support levels varied depending on MA term, with the highest level of support offered to MAs with a term of three years. MAs with a term of three years were supported with a contribution of 60% of actual costs, up to a maximum £10,000 contribution.
Percentage contributions were adjusted for MAs with a shorter term, with contributions of 50% for two-year agreements and 45% for one-year agreements. Capital projects supported included a lambing polytunnel, creation of new hill parks and livestock handling facilities.
Figure 6 below provides an overview of the number of holdings receiving enhanced or capital support in individual years in the period 2020-2023.
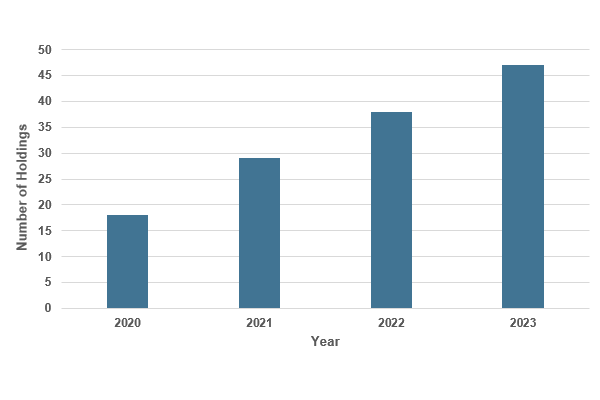
Figure 6: Number of holdings receiving enhanced or capital support 2020-2023
Figure 6 highlights the increase in the number of holdings receiving enhanced or capital support from 18 in 2020 to 47 in 2023. A greater awareness of the revised SEMS, alongside recognition of management system changes, with a number of holdings moving to indoor or in-bye lambing instead of hill lambing, can explain some of the increases seen in this period.
In addition, the increase in uptake of the enhanced shepherding measure also explains the overall increases highlighted in Figure 6 above. The number of holdings receiving support for enhanced shepherding in the period is detailed in Figure 7 below:
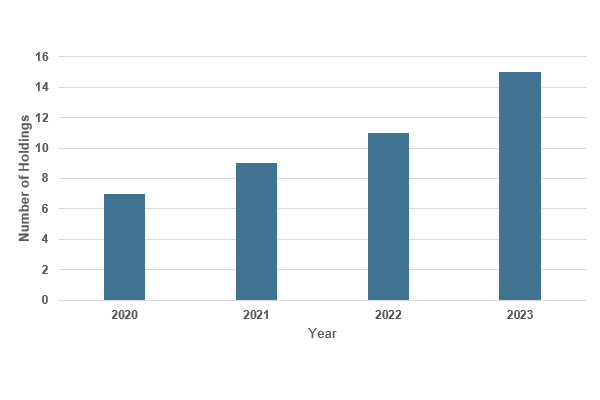
Figure 7: Number of holdings receiving support for enhanced shepherding 2020-2023
From Figure 7, the increased participation in enhanced shepherding is clear, with the number of holdings participating more than doubling between 2020 and 2023. Due to the complexity of sea eagle predation issues and the range of factors that can influence lamb loss in extensive systems, farmer and crofter perception and feedback on this measure is a key measure of effectiveness.
Feedback on this measure has been mixed and can be viewed in the spreadsheet that accompanies this report. In some locations, there was positive feedback accompanied by an observed reduction in the levels of lamb loss, which coincided with the initial delivery of this measure. An example of this from a farm in Argyll is detailed in Figures 8 and 9 below:
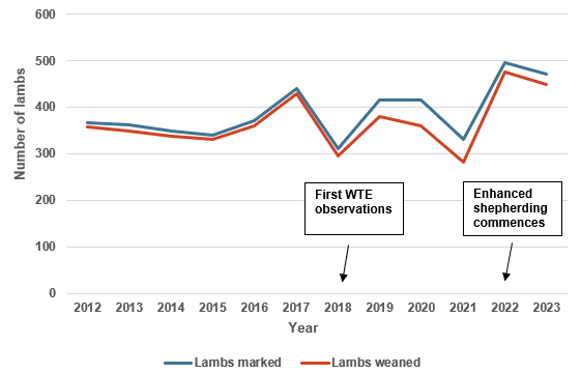
Figure 8: Number of lambs marked and weaned at an Argyll farm 2012-2023
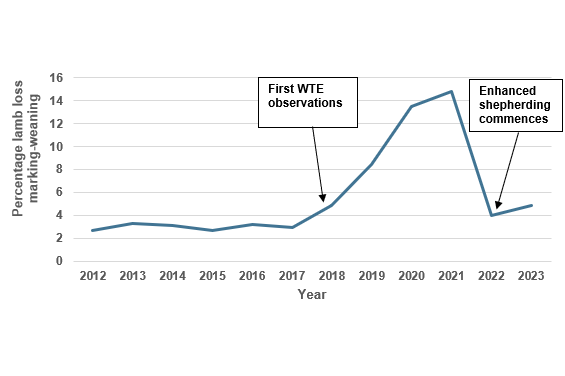
Figure 9: Percentage lamb loss marking-weaning at an Argyll farm 2012-2023
Figure 8 highlights the increase in the number of lambs lost between marking and weaning in the years following the first observations of WTE at the farm. In the period pre-2018, the average number of lambs lost was eleven. From 2018 to 2023, the average was thirty-three lambs. In the two years of enhanced shepherding, 2022 and 2023, the average number of lambs lost was twenty-two. The period when enhanced shepherding has been delivered has seen the highest numbers of lambs at both marking and weaning recorded, with the number of ewes in the flock not changing significantly across the whole period.
Figure 9 highlights the increase in percentage lamb loss in the marking-weaning period that coincided with the first observations of WTE at the farm. Percentage lamb loss in the marking-weaning period peaked in 2021, with the first year of enhanced shepherding, 2022, coinciding with a significant reduction in the levels of lamb loss in this period. In the pre-2018 period, average percentage lamb loss in the marking-weaning period was 3%. In the period, 2018-2023, the average was 8.4%, with an average of 4.5% in the period when enhanced shepherding has been delivered.
Positive feedback on this measure, reductions in loss levels and improved performance have not been reflected at all holdings delivering enhanced shepherding as is evident in Figure 10 below which considers marking-weaning performance at two sheep stock club’s that have delivered this measure.
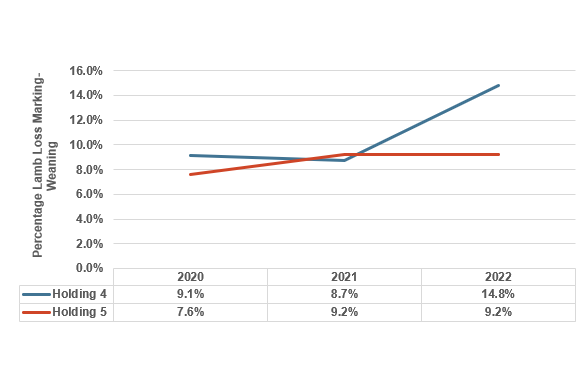
Figure 10: Percentage lamb loss marking-weaning at two SSCs 2020-2023
Both sheep stock clubs represented in Figure 10 started delivery of enhanced shepherding in 2020. The improvements in performance that coincided with enhanced shepherding delivery at the Argyll farm were not replicated in the performance of the two sheep stock clubs, with Figure 10 showing that there has been a general increase in losses between marking and weaning in the 2020-2023 period.
At holding four, it was felt by club shareholders that there was an initial observed benefit with the measure; however, WTE have now become habituated to human presence on the hill, with 2022 reported as being a particularly bad year in terms of eagle and livestock interactions. At holding five, it was felt that there were benefits on the areas that this measure was targeted, however this resulted in increased losses in other hefts, with the feeling being that the impacts were being moved on to other parts of the flock, where this measure wasn’t being delivered to the same extent.
The extensive nature of these holdings and the hefted nature of these flocks makes finding solutions for these holdings challenging, however this measure has demonstrated the collaborative and adaptive approach being taken to try to mitigate issues.
More information on this measure and feedback is detailed in the 2020 and 2021 Enhanced Shepherding Summary Reports and collated feedback spreadsheet, with the 2022 and 2023 Summary Reports in preparation.
Call off contractor and observer work
In 2020, the SEMS had a core team of six call off contractors. This expanded to seven in 2021, due to the growth in interest in the SEMS in the Western Isles. In addition to the RoI work outlined previously, the call off contractor team delivered a range of additional fieldwork in the 2020-2023 period across Scotland.
This included nest clearance and associated prey remains analysis work completed in 2021 and 2023, design of additional observation work at monitor farm and enhanced shepherding sites, productivity checks, camera trap work, both at WTE nests and at monitor farm sites and provision of advice on the setup and use of scaring equipment.
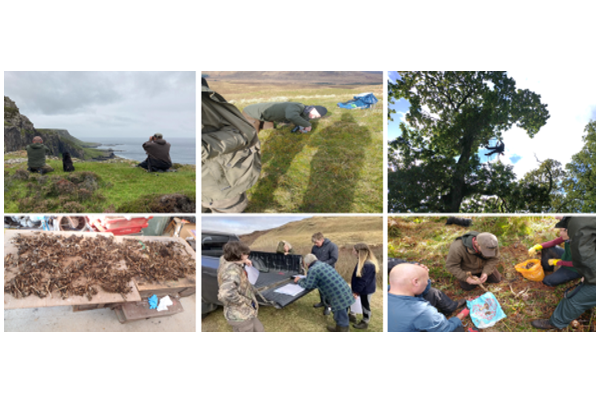
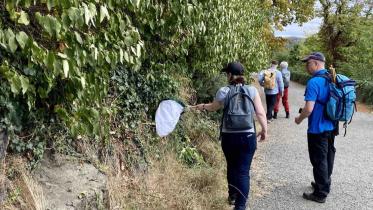
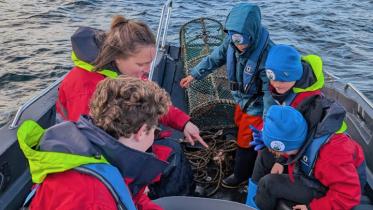
Figure 11: Some examples of call off contractor and observer work. From top left, productivity checks, camera trapping, nest clearance, liaison with farmers and crofters and prey remains analysis.
In addition to the work of the call off contractor team, a team of observers were working at selected sites in Argyll and Lochaber to investigate sea eagle interactions with sheep flocks on extensive areas and in some cases, support farmers delivering enhanced shepherding.
In total, six holdings received support in the form of the observer team in the period 2020-2023. This supporting observation work is detailed in individual holding enhanced shepherding reports, with any key findings detailed in the enhanced shepherding summary reports.
Whilst much of the work delivered by the call off contractor and observer teams at study sites focused on WTE, the data collected from some sites also highlighted the wider biodiversity present on these holdings, with the management there supporting a number of locally and nationally rare or threatened species.
This was evident in camera trapping at a study farm in Argyll with the images in Figure 12 below highlighting some of the species recorded there.
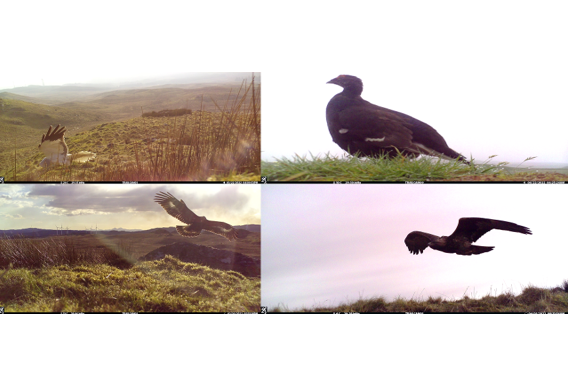
Figure 12: From top left, hen harrier, black grouse and golden eagle recorded at an Argyll study farm site
In addition to hen harrier and black grouse, recorded through camera trapping and field observations, five other red-list bird species were recorded alongside seven amber-list bird species. At another study farm site in Argyll, observers recorded the threatened marsh fritillary butterfly, with seven species of raptor also recorded on this farm, highlighting the importance of the mosaic of habitats at both study sites and the sensitive livestock management that helps supports these species.
The work of the call off contractor and observer teams in the period 2020-2023 has been an integral part of delivery of the SEMS and the contributions of this team are acknowledged in both formal and informal feedback from participating farmers and crofters.
Lambing performance data 2020-2023
Part of the reporting requirements of the SEMS includes the provision of annual lambing performance data. Data reported to the SEMS in the period 2020-2023 has been collated with consideration of performance from scanning-marking, scanning-weaning, marking-weaning and overall weaning performance at SEMS holdings.
Scanning-marking and scanning-weaning
Pregnancy scanning of ewes is a useful tool when planning for an upcoming lambing season. It allows confirmation of pregnancy status and the identification of barren ewes. In addition, it also allows the identification of ewes carrying multiple lambs and the allocation of appropriate feeding ratios in the lead up to lambing.
Scanning also allows separation of ewes pre-lambing to different lambing locations depending on pregnancy status. For example, ewes carrying multiple lambs are often retained in-bye and lambed there or indoors, with ewes carrying single lambs often returned to the hill for lambing.
When interpreting losses from scanning to marking and scanning to weaning it is important to recognise that scanning only gives an indicative figure of expected lambs.
There can be factors, which influence whether ewes carry a lamb or lambs full term to birth. For example, in a hill flock, adverse weather conditions in late winter and early spring can affect ewe mortality rates and subsequent expected lambs. This was evident on some SEMS holdings in 2018, with the “Beast from the East” storm resulting in ewes and expected lambs being lost in snow.
Figure 13 below outlines the average, high and low percentage loss figures from expected lambs at scanning to lambs present at marking recorded at SEMS holdings in the 2020-2023 period.
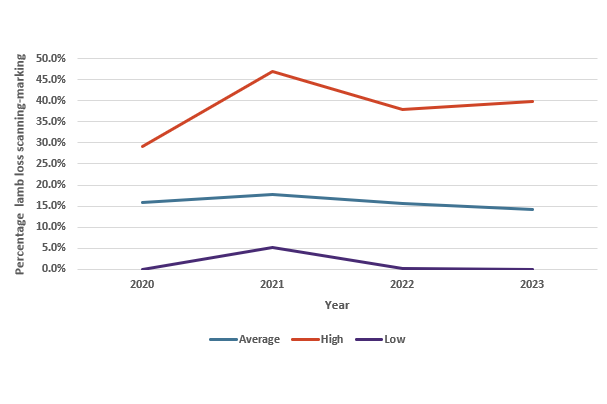
Figure 13: Average, high and low percentage lamb loss* scanning-marking recorded at SEMS holdings 2020-2023
Year | Sample size |
|---|---|
2020 | 27 |
2021 | 41 |
2022 | 47 |
2023 | 55 |
Average losses from expected lambs at scanning to lambs present at marking, when lambs are generally around 6-8 weeks old, ranged from 14.2-17.9%, in the 2020-2023 period. It is clear from the low and high percentage loss figures in Figure 13, that there is a wide range of loss levels in this period between flocks participating in the SEMS.
There were some flocks that recorded very low or no lamb loss in the scanning to marking period. All of these flocks lambed either indoor, in-bye or a combination of both. However those flocks which recorded the highest figures in the period from scanning-marking, all had an element of in-bye lambing or indoor lambing in their management system, with either hill or hill park lambing featuring in the management of three of the four holdings recording the highest figures in the period.
There were only three holdings that lamb solely on the hill or a combination of hill and hill parks that reported scanning performance figures in the 2020-2023 period, so a comparison with the forty holdings reporting scanning performance figures that lamb solely in-bye, indoors or a combination of both was not possible.
The small dataset of locks that lamb solely on the hill or a combination of hill and hill parks is not surprising in relation to performance from scanning. One of the main reasons for not scanning cited by participating farmers and crofters operating a hill system is the inability to separate ewes carrying multiple lambs, due to no or limited in-bye ground. For this reason, some farmers and crofters do not consider it cost effective or practical to scan their flocks.
Figure 14 below considers the average, high and low percentage loss figures recorded from expected lambs at scanning to lambs present at weaning at SEMS holdings in the period 2020-2023.
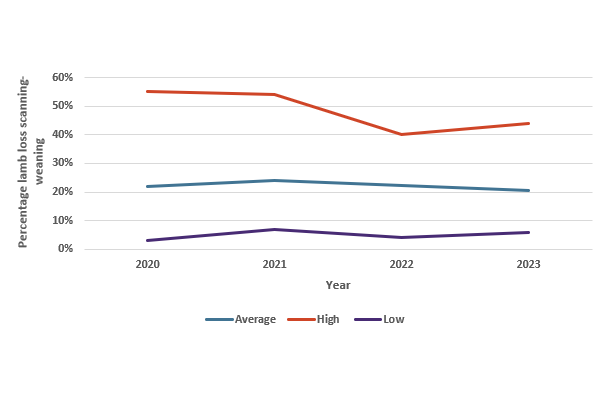
Figure 14: Average, high and low percentage lamb loss* scanning-weaning recorded at SEMS holdings 2020-2023
Year | Sample size |
|---|---|
2020 | 29 |
2021 | 42 |
2022 | 37 |
2023 | 57 |
Average percentage lamb loss from expected lambs at scanning to lambs present at weaning ranged between 20% and 24% in the period 2020-2023, but as with percentage loss in the scanning-marking period, there was wide ranging performance between flocks in the SEMS in this period, as highlighted by the low and high figures recorded in individual years.
It is clear from Figure 14 that some flocks recorded very low levels of loss from scanning through to weaning; however, there was no consistent characteristics in terms of the flocks recording the lowest percentage loss. For example, not all of these holdings would be considered smaller in extent or flock size and the initial lambing location and management of the flock post marking also varied.
This was evident in 2023, when four holdings recorded the lowest levels of lamb loss in the scanning-weaning period of 6%, with the table below outlining the different management systems and scale of each.
| Holding Number | Location | Area Managed | Breeding Ewes | Lambing Location | Post Marking Location |
|---|---|---|---|---|---|
| 1 | Skye & Lochalsh | 104 Ha | 75 | In-bye | In-bye |
| 2 | Lochaber | 76 Ha | 60 | In-bye | Hill parks |
| 3 | Skye & Lochalsh | 306 Ha | 330 | Indoor and In-bye | In-bye |
| 4 | Argyll | 887 Ha | 896 | Hill | Hill |
Table 1 outlines the range in both the area managed and breeding ewe number at holdings that all recorded the lowest scanning-weaning percentage loss of 6% in 2023. Table 1 also highlights that whilst in-bye lambing is practiced at three of the four holdings, a hill flock in Argyll was still able to achieve the same low level of loss across this period.
The factors influencing levels of loss in individual years are difficult to interpret given their wide-ranging nature and as previously mentioned, interpretation from scanning figures is of expected lambs, unless there is a count of lambs at birth, which is rarely practiced or practical outside of smaller flocks. Interpretation of loss levels from marking to weaning is more accurate as this period covers lambs that are known to be present and is considered further below.
Marking-weaning
For those flocks that do not scan, marking is a key period in the lambing season, which will give a first indication of performance. The timing of marking will vary from holding to holding, however, for the purposes of data collection associated with the SEMS; the marking period is defined as the count of lambs following the first gather of the hill after lambing, for those running extensive hefted hill flocks.
For those lambing in-bye, marking is defined as the count of lambs in the period immediately before turnout to the hill. For those retaining the flock in-bye a marking count will generally mean a count of lambs at 6-8 weeks old.
It is important to note the differing definitions and management systems when considering marking-weaning data, especially as the timing of turnout to the hill has been delayed further than traditionally at some holdings, with contributions towards the associated costs of this supported through the SEMS.
As is the case with all lambing performance data, it is important to consider performance at an individual level when making comparisons and considering management support. However, for the purposes of this report, the collated data in this period provides a useful overview. Figure 15 below outlines the average, high and low percentage loss figures in the marking-weaning period recorded at SEMS holdings in individual years in the period 2020-2023.
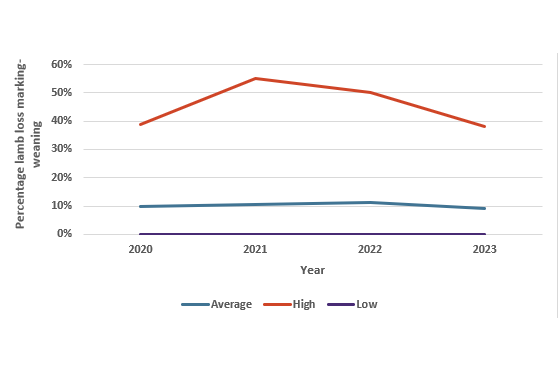
Figure 15: Average, high and low percentage loss marking-weaning recorded at SEMS holdings 2020-2023
Year | Sample size |
|---|---|
2020 | 95 |
2021 | 118 |
2022 | 138 |
2023 | 148 |
Average percentage lamb loss in the marking to weaning period ranged between nine and eleven percent in the 2020-2023 period. From Figure 15 it is clear, that as with losses in the scanning to marking and scanning to weaning period, there was wide ranging loss levels in the marking-weaning period between SEMS holdings.
Twenty-three holdings recorded percentage lamb losses in the marking to weaning period below the average figure in each of the individual years in the period. This included six holdings that consistently recorded lamb losses in this period of less than five percent.
In contrast, eleven holdings recorded above average losses in each of the individual years in the period, with two holdings consistently recording percentage losses above twenty-five percent in the 2020-2023 period.
It was also evident in the data that there was wide ranging performance between years on SEMS holdings, including some of those who recorded no losses in an individual year in the period, with Table 2 below demonstrating this.
| Holding Number | Location | 2020 Marking-Weaning Percentage Loss | 2021 Marking-Weaning Percentage Loss | 2022 Marking-Weaning Percentage Loss | 2023 Marking-Weaning Percentage Loss |
|---|---|---|---|---|---|
| 1 | Western Isles | 22% | 0% | 13% | 14% |
| 2 | Skye & Lochalsh | Not in SEMS | 35% | 16% | 0% |
| 3 | Skye & Lochalsh | 20% | 3% | 11% | 0% |
Table 2 highlights the variation in lamb loss experienced on three SEMS holdings in the period 2020-2023, with holding two showing the greatest variance with a range from 0-35%. The data in Table 2 again highlights the importance of considering performance and loss levels at an individual flock level, in attempts to better understand patterns and the role of WTE in these losses.
Weaning percentage
Weaning percentage is an important performance benchmark and is calculated by dividing the number of lambs weaned by the number of ewes run with tups and multiplying this value by one hundred.
In a hefted hill flock, weaning percentage is especially important, as these flocks rely on recruitment of ewe lambs from within the flock as replacements, in order to ensure a healthy flock age structure and long-term sustainability of this management system.
Decreases in overall weaning percentage and associated ewe lamb numbers can have a significant impact on the flock and the business, as for those farmers and crofters managing Region 3 ground, the number of retained ewe lambs influences the level of support from the Scottish Upland Sheep Support Scheme (SUSSS). Figure 16 below provides an overview of the average, high and low weaning percentages recorded at SEMS holdings in individual years in the period 2020-2023.
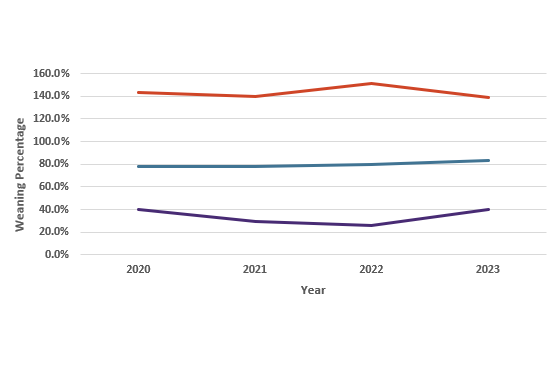
Figure 16: Average, high and low weaning percentage from SEMS holdings 2020-2023
Average weaning performance at SEMS holdings in the period 2020-2023 ranged between 77.9% and 82.9%; however, the range of performance recorded between holdings was again evident as seen from the low and high figures recorded in each individual year in the period.
Twenty holdings recorded weaning percentages above the average in each individual year across the 2020-2023 period. This included six holdings which recorded weaning percentage figures of 100% or above in each individual year in the period 2020-2023.
In comparison, twenty-eight holdings recorded below average weaning percentage figures across each individual year in the period 2020-2023. This included nineteen holdings that recorded weaning percentage figures below 75% in each individual year in the period 2020-2023.
Weaning performance figures in individual years in the period 2020-2023 have been collated and categorised using pie charts in Figure 17 below to provide an overview of performance at SEMS holdings in the 2020-2023 period.
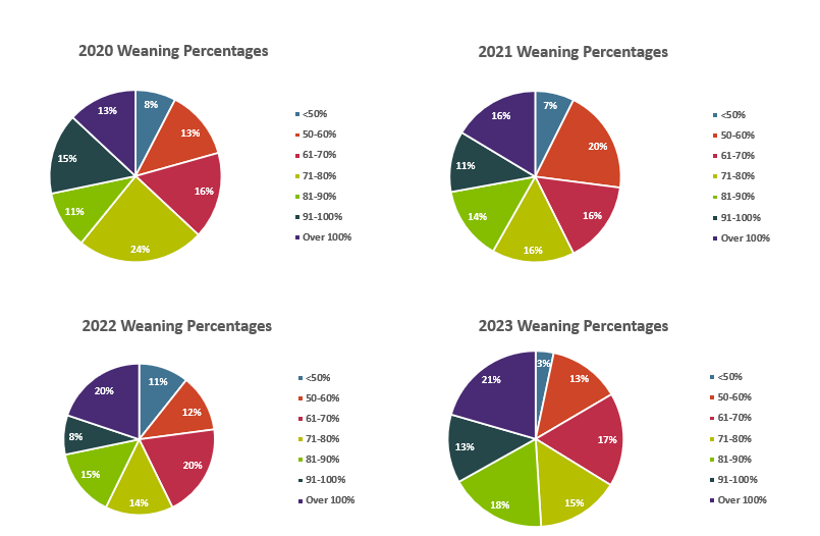
Figure 17 - Categorised weaning percentages at SEMS holdings in individual years in the period 2020-2023
Click for a full description
View a larger version of this image.
The pie charts in Figure 17 above provide a visual representation of the range of weaning percentages achieved at holdings in the SEMS in the period 2020-2023.
When weaning percentages from flocks that have participated in the SEMS for greater than one year in the period are considered in further detail, it is clear that the majority of holdings (75%) fluctuate between performance categories in the period. This is to be expected, given the wide-ranging nature of the factors that can influence loss levels and subsequent performance between years.
Of the holdings that fluctuated between weaning percentage categories in the 2020-2023 period, the greatest difference in the range of performance levels between years in the period was 50%, with a weaning percentage of 63.6% recorded in 2021 followed by 113.6% the following year. Poor performance from the tup in 2021, directly influenced performance with this subsequently remedied the following year at this holding.
Some holdings have shown improved weaning performance in the period and it is possible these improvements could be attributed to changes in management, with associated support from the SEMS.
An example of this is a holding in Skye, where support for away-wintering and the subsequent change of lambing location from the hill to in-bye, where ewes and lambs were retained in 2023, has resulted in weaning performance of 87.5% in 2021, 102% in 2022 and 127.1% in 2023.
It is important to note that management changes, with support from the SEMS as described in the example above, are not a feasible option for every situation, hence the flexible nature of the SEMS in supporting a wide range of options, depending on individual management system.
Of the remaining 25% of holdings participating in the SEMS for more than one year in the period where weaning percentage did not fluctuate between categories, 69% recorded weaning percentage figures above 75%, with 40% recording weaning percentage figures above 100%.
Seven holdings recorded weaning percentage figures consistently below 70%, with the majority of these holdings utilising the hill for an element of their lambing.
The average holding size at these holdings was nearly three times that of the average size of the holdings consistently achieving above 100% weaning percentages in the period.
Of the holdings consistently achieving over 100% weaning percentages, only two (12.5%), utilised the hill or hill parks for lambing, with the majority lambing indoors, in-bye or a combination of both.
Despite the above observation, across the wider dataset, there was only one year, 2023, where there was a very noticeable difference in weaning performance achieved, between those holdings practicing solely indoor, or in-bye lambing, or a combination of both and those holdings practicing solely hill or hill park lambing or a combination of both, as Figure 18 below highlights.
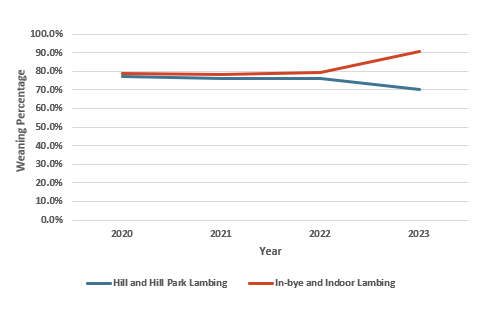
Figure 18: Average weaning percentages at SEMS holdings practicing solely indoor and/or in-bye lambing and hill and/or hill park lambing 2020-2023
From Figure 18 it is clear that despite those holdings practicing solely indoor and/or in-bye lambing achieving higher weaning percentages across the period than those practicing solely hill and/or hill park lambing, the differences in performance are minimal with the exception of 2023, when there is a difference of greater than 20%.
Whilst lambing indoors and/or in-bye allows greater supervision and can limit exposure risk in the days immediately following birth, ultimately for a number of these holdings, ewes and lambs will be turned out to the hill, where the risk of loss to factors including predation is greater.
This could help explain why there is not a noticeable difference in the average weaning percentages until 2023, where there is clearly a factor or factors that have influenced the difference between the averages.
The data in Figure 18 above, along with the previously discussed performance data from key periods in the lambing season, clearly highlights the importance of a case-by-case approach to investigating and understanding patterns of lamb loss on individual holdings and the role of WTE in these losses.
Concluding remarks
WTE predation of livestock is a complex issue and the lambing performance data from SEMS holdings detailed in this report highlights the wide-ranging nature of performance across SEMS holdings.
This is reflective of the differing management systems at SEMS holdings, the nature of issues with predation and other factors influencing loss and the scales of these impacts, with this report highlighting the flexible and often tailor-made approach taken in this SEMS period in attempts to mitigate predation impacts.
The views and feedback of some farmers and crofters experiencing WTE predation and participating in the SEMS have been collated in the accompanying spreadsheet.
It is clear from the collated feedback that there are mixed views on the effectiveness of the SEMS in mitigating issues and the appropriateness of the support levels in reflecting the costs of living and working alongside WTE.
However from feedback it is clear that there is generally a consensus that the SEMS in the period 2020-2023 and the approach taken, has improved from the area based nature of support in the previous SEMS.
NatureScot recognises the concern and seriousness of this issue to some farmers and crofters across parts of Scotland and continues to work closely with stakeholders at a local and national level to find solutions. The feedback collated in this period, will help to inform the review of the SEMS and stakeholder discussions.
Acknowledgements
NatureScot acknowledges and thanks the farmers and crofters who have liaised closely with SEMS staff in this period in order to deliver the approach to enhanced support, which has required close communication and provision of data. NatureScot also acknowledges the feedback provided on the enhanced and capital elements of the SEMS, which will be considered as part of the review.
NatureScot acknowledges the vital role of the call off contractor and observer team in this period in providing expert advice and assistance in the delivery of the SEMS, including associated monitoring and liaison work. Thanks also go to Scottish Raptor Study Group, FLS and RSPB Scotland colleagues who have provided data and support to inform and assist with fieldwork in this period.


