Research Reports – report template, accessibility guide, and sample report
Research Reports – accessibility guide
Reports prepared by contractors in fulfilment of contracts with NatureScot are now published on our website in html format to comply with the accessibility legislation. This guidance should be used together with the report template and the sample report, which can be downloaded at the bottom of this page.
For any questions on using our template or accessibility requirements please email research@nature.scot
The SCULPT Framework
To make digital accessibility approachable and easy to understand, we use the SCULPT framework which is an acronym of six bite-sized basic concepts.
SCULPT Framework
Click for a full description
SCULPT now stands for:
- S stands for structuring a document using headings
- C stands for colour contrast
- U is use of images
- L refers to links
- P is plain language and clear fonts
- T stands for tables
SCULPT by Helen Wilson is licensed under a Creative Commons Attribution-NonCommercial-ShareAlike 4.0 International License. Based on work at Worcestershire County Council
S stands for structuring a document using headings and page setup

Structured headings are the most important accessibility consideration in documents. People who use a screen reader or use keyboard only tabbing, use headings to navigate through the document. They are also used to automatically create a table of contents.
Unfortunately, 'headings' are often created by highlighting the text and applying Word's Font styles (larger size, bold, font family). These Font styles will provide visual headings but not the document structure needed for navigation by assistive technology.
To add a heading style to text in Word:
- select the text you want to format
- in the ribbon, choose the Home tab
- select a style
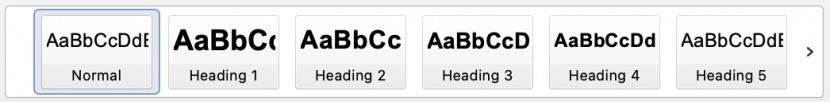
- A Heading 1 is for the title. Only use one H1 in your document
- A Heading 2 should identify the main sections of your content.
- A Heading 3 is a sub-section of the Heading 2.
- A Heading 4 is a sub-section of the Heading 3, and so on.
You should not skip heading levels, such as using a Heading 3 after Heading 1.
![]() See video from Microsoft on how to use styles for headings to make your documents easier to navigate.
See video from Microsoft on how to use styles for headings to make your documents easier to navigate.
Test it out
- On the View tab (In the ribbon), select Navigation Pane (in 'show' section).
- A window will appear on the left of your screen. Select 'Headings' to view the Hierarchy of headings. These should also read logically.
Test the accessibility of your document
- Go to File (in the ribbon), select Info (in the left navigation).
- Click the box Check for issues and select check accessibility.
- The Accessibility Assistant window will appear on the right hand side with an easy guide on what to check and how to change it.
Document title
As well as the filename you also need to check the 'document title' in the document metadata and add your title here.
Click File > Info > then in the right column enter your document title.
Document language
The language must be defined. This may happen automatically, but may be missing documents you have not created yourself. The language must be defined correctly for screen readers.
Click File > More > options > Language (in pop up window) > and check the appropriate default language is set.
C stands for colour contrast

Colour contrast between text and background is important on web pages. It affects some people’s ability to perceive the information (in other words to be able to receive the information visually). You will need to check that any images, such as graphs or maps, have a compliant colour contrast before submitting your report to NatureScot project manager. Consider using patterns as an alternative or a way to accentuate charts or graphs.
Please use NatureScots brand colours. You can use a combination of these colours with white or black text until you find a colour combination that is accessible.
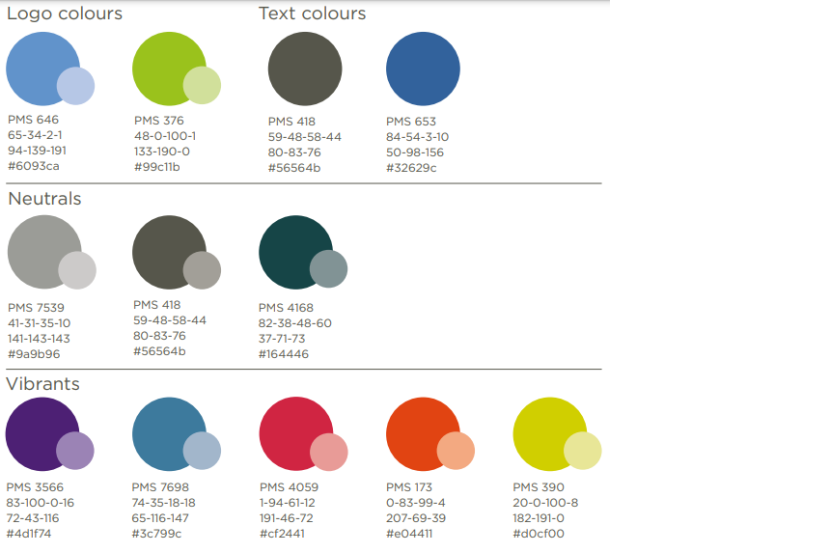
Figure 1. NatureScot brand colours
Click for a full description
Our nature-inspired colour palette consists of the logo colours, neutral and vibrant colour collections along with their tints and a text colur. These should be used for all NatureScot communications under both the main brand and the sub brands.
Each swatch shows the PANTONE (PMS) colour, CMYK, RGB ans HEX values.
It includes a 50% tint. You can use any % tint as long as it is accessible. To keep a sense of coherence, aim to keep to one, or a maximum of two, highlight colours within a document. Tints of the same colour are counted as one colour.
In order from top left to right and down.
Logo Colours
- PMS 646, 65-34-2-1, 94-139-191, #6093ca
- PMS 376, 48-0-100-1, 133-190-0, #99c11b
Text colours
- PMS 418, 59-48-58-44, 80-83-76, #56564b
- PMS 653, 84-54-3-10, 50-98-156, #32629c
Neutrals
- PMS 7539, 41-31-35-10, 141-143-143, #9a9b96
- PMS 418, 59-48-58-44, 80-83-76, #56564b
Vibrants
- PMS 3566, 83-100-0-16, 72-43-116, #4d1f74
- PMS 7698, 74-35-18-18, 65-116-147, #3c799c
- PMS 4059, 1-94-61-12, 191-46-72, #cf2441
- PMS 173, 0-83-99-4 ,207-69-39, #e04411
- PMS 390, 20-0-100-8, 182-191-0, #d0cf00
Please refer to our NatureScot brand guidelines for more information
Test it out
WebAIM provides a free colour contrast checker to assist with developing compliant content. Make sure it passes WCAG AA standard.
![]() See a video on How to test for colour contrast
See a video on How to test for colour contrast
U is use of images, videos and maps

All images, graphics and photos are better displayed as a landscape 3:2 ratio. Portrait images are accepted but they can appear too elongated, over-sized and are generally only partially visible in the visual area of the screen.
Images (photographs, maps, as well as graphs and charts that weren’t created in Microsoft Word or Excel) should be provided to your NatureScot project manager as high-resolution files in .png or jpg format.
In your report, please include all figures in the Figures section after the References section.
Add a placeholder text in the text of your report where the figure should appear in the html version. For example:
Figure 1
This will tell us that this is where Figure 1 should appear in the html. Use Normal style and apply bold font to it to make it stand out from the text of your report.
All figures require a caption and alt text. Complex images, such as graphs or charts, also need a long description. We have explained the accessibility requirements for each of these below. Here is an example below of how it will be presented on the web page.
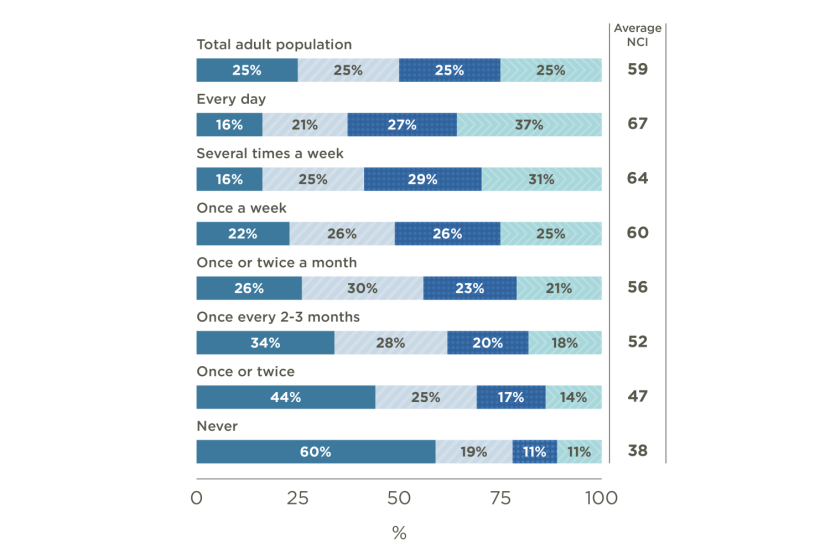
Figure 3: Nature Connection Index by frequency of visits to the outdoors
Click for a full description
Base: All respondents (n=12,053). Demographic weight applied. Figures rounded to nearest whole number.
100% stacked bar chart showing the Nature Connection Index quartile distribution amongst the total adult population and amongst sub-groups of the population segmented on the basis of their frequency of outdoor recreation visits in the last 12 months.
Bars are oriented horizontally, with the total adult population at the top and each level of frequency listed on the y axis ordered from Every Day to Never. The bars are segmented into different colours according to the percentage in each quartile, ranging from the Lowest quartile (0-34 NCI) in light grey to Second quartile (35-48 NCI) in dark grey to Third quartile (61-78 NCI) in light blue to the Highest quartile (84 – 100 NCI) in dark blue.
The average NCI for the total adult population and for each of the groups are also shown on the right of the chart.
The data are summarised in the following table:
| Frequency of outdoor visits | Lowest quartile | Second quartile | Third quartile | Highest quartile | Average NCI |
|---|---|---|---|---|---|
| Total adult population | 25% | 25% | 25% | 25% | 59 |
| Every day | 16% | 21% | 27% | 37% | 67 |
| Several times a week | 16% | 25% | 29% | 31% | 64 |
| Once a week | 22% | 26% | 26% | 25% | 60 |
| Once or twice a month | 26% | 30% | 23% | 21% | 56 |
| Once every 2-3 months | 34% | 28% | 20% | 18% | 52 |
| Once or twice | 44% | 25% | 17% | 14% | 47 |
| Never | 60% | 19% | 11% | 11% | 38 |
Captions
Captions for the image is text visible under the image. Prefix your caption text with Figure X:
Keep your captions short. Captions have a 250 character limit including spaces on our website. Additional information can be added in the long description if required.
Alt text
Alt text is a very short description of what is shown on the image for someone who can’t see it. Screen readers read alt text and provide an audio description of an image. You can’t see alt text in html, it’s embedded in the html code.
When writing alt text:
- keep it short and descriptive, like a tweet
- describe only what is on the image
- don’t include ‘image of’ or ‘photo of’
- but if it’s a map or a graph specify that in the alt text, for example ‘A bar chart showing...’
- Sign posting - If the description of the image has already been described elsewhere in the content, then use the alt text to sign post where that description e.g. as described under heading xxx of the xxx report.
It is not a requirement to apply alt text to the images directly in your MS Word version if you include it in the Figures section. This will make it easier for us to add alt text to the html version.
Long description
Complex images, like graphs and charts, require what’s called a long description. A long description should explain in detail what is shown on the graph or chart. Avoid mentioning colour or visual references in the long description. In the example graphic above, you can use simple tables as an alternative in the long description to describe a graph or chart.
Our sample report has examples of alt text and long descriptions for complex figures. The diagram centre has also developed an excellent resource with examples of long descriptions for different types of complex images, such as graphs and diagrams.
Do not duplicate the description of the image if it has already been provided elsewhere in the document. Please refer to the alt text and the bullet on signposting.
Graphs and Diagrams (infographics)
For graphs, if you use colour-only to convey meaning: this makes it accessible to colourblind and visually impaired readers (through producing tactile figures). Make sure to also use
- clear labelling,
- textures (e.g. solid, vertical or horizontal stripes, crosshatched),
- line styles (e.g. solid line, dashed, dash-dotted),
- shapes (e.g. open circles, closed circles, diamonds)
Before using a diagram (such as a process map or a flow chart), consider whether the message can be communicated better through headers & paragraphs, bullets, a table or accordions (please see Tables). Users often find them difficult to understand or read, especially if they contain a lot of text.
- If you include a diagram, captions and long description should be provided.
- Ensure all fonts are large enough and in a clear typeface.
- Keep the amount of text to a minimum and use your long description to fully explain its meaning.
Equations
Unfortunately, html does support equations. Equations on the web are simply images of text saved formats such as .png. Since equations displayed as image files are not accessible to people who rely on screen readers, we need to provide alt text and a long description with them. The long description should spell out the name of each of the symbols in the equation.
Alt text
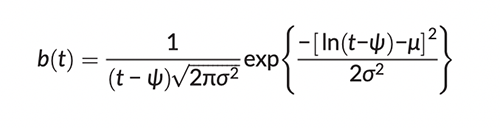
Equation for distribution of grey seal pup births
Long description
Ground counts of marked pups suggest that the distribution of birth date is unimodal and skewed to the right, and can be represented by a lognormal distribution where b(t) is the probability of a pup being born on day t, and ψ is the first day on which any pups can be born. If ψ is much less than the mean birth date, ψ + exp(μ + σ2/2), the distribution is almost symmetrical, whereas if ψ is close to the mean it is heavily skewed to the right. The expected number of births that have occurred by the date of a given flight is therefore B times the integral of b(t) from ψ to that date, where B is the total pup production.
This equation example comes from:
Russell, D.J.F., Morris, C.D., Duck, C.D., Thompson, D. and Hiby, L. 2019. Monitoring long‐term changes in UK grey seal pup production. Aquatic Conservation: Marine Freshwater Ecosystems, 29(S1), 24–39.
Videos
As reports are now published in html, it is now possible to have short videos in your report. Please get in touch with your NatureScot project manager if you would like to include videos. We’ll be happy to discuss the accessibility requirements for videos with you.
Maps
Maps should be included in the Figures section and labelled as figures. Maps are exempt under the accessibility legislation. This means that you need to provide captions and alt text, but long descriptions are not mandatory.
While long descriptions for maps are not required, we would encourage you to provide them. Explain in the long description what information the map is trying to convey. Maps should include any text, keys and copyright information as part of the long description. An example of a long description for a map is given in our sample report.
L refers to links

If you need to include any links in the text of your report embedding the hyperlink within meaningful text can make it easier to understand for users who rely on screen-readers.
Here is a typical url in the text of a document:
https://www.nature.scot/scotlands-biodiversity/helping-scotlands-pollinators
For a sighted user, this might seem fine, but if you rely on a screen reader or text-to-speech program, it might read the url out one letter at a time.
Instead, please embed the hyperlink within text:
Find out more about Scotland's Pollinator Strategy, projects, resources and how to get involved.
Avoid phrases like ‘click here’ or ‘learn more’ when adding display text. Screen reader users can list the links out of context as a form of navigation. Users will get lost if the links are vague. Use something meaningful that gives the user an idea of the content or says where the hyperlink goes.
![]() Learn how to create meaningful hyperlinks in this video from Microsoft.
Learn how to create meaningful hyperlinks in this video from Microsoft.
P is plain language

Scientific reports don’t have to be complicated. Complex language can be very difficult for some people, including specialist audiences, especially where English is not their first language. Everyone should have access to clear and concise information. Plain English is about writing clearly in the right tone of voice with the reader in mind. It means avoiding the use of long overly complicated language, such as jargon, unexplained acronyms and long words.
Basic principles include:
- Keep your sentences short
- Prefer active verbs
- Use 'you' and 'we'
- Use words that are appropriate for the reader
- Use lists where appropriate
- Expand acronyms on first use.
- Use italics for scientific names
- Use bold to highlight important information.
We can highlight important paragraph(s) of text by giving it a box appearance and a branded blue background.
Refer to our website content style guide for more information on how to write for the web.
The Plain English Campaign offer a free 'How to write in Plain English' guide.
T stands for tables

Please include all tables in the Tables section at the end of your report.
Add a placeholder text in the text of your report where the table should appear in the html version. For example:
Table 1
This will tell us that this is where Table 1 should appear in the html. Use Normal style and apply bold font to it to make it stand out from the text of your report.
Create accessible tables
Setting up tables correctly allows screen readers to read them aloud for visual impaired users or to tab in the right order for keyboard-only users. Some table design can trip up even the best screen-reading programs or they can’t be recreated on the web page.
Tables should only be used to present data, and not for visual layouts of your content. Here are some other considerations:
- Include a title/caption and summary. Titles indicate the topic covered; summaries (sometimes as part of the title) provide a brief overview and should include guidance on how to interpret the data. Screen reader users use them to decide if they want to engage with the material.
- Properly tag column and row headers. A screen reader will read out the data cell-by-cell. Without tagged column and row headers, those cells will be read out without any context or orientation. (see 'labelling you table' below on how to do this)
- Make the table no more complex than necessary. Many complex or nested tables can be broken up into smaller, simpler tables. A simpler table allows for greater accessibility, and lower cognitive load for all users.
- Avoid using a table for layout. Use it only for data. Some information (such as sentences) isn't meant to be in a table. You should not use tables to organize such information because it isn't structured to work properly for people who use screen readers. Screen readers will announce to the user that there is a table, but since the table will not have proper column and row headers, the data will not make sense. Instead of organising information with a table, try using a two or three column layout instead or headers and paragraphs.
- Don’t use merged or split cells. Content in Merged cells, especially in headers, can be used in the title of a table or the table can be split into smaller tables.
- Avoid empty cells. Empty cells might be used to visually format the table, such as to indicate a division in various sections of the table. While this practice may make sense for sighted users, it may not work for visually impaired or keyboard-only users. One alternative to using white space for formatting a single table may include using multiple tables. If you have empty data cells, please insert dash ‘-’ symbol, NULL or N/A into the cell. Be cautious when using symbols, different screen readers may interpret symbols in varying ways or not at all.
- Coloured text and shaded cells will not transfer onto the web page. Instead of using colours or symbols, use the correct wording to spell out their meaning.
- Large tables with more than 5 or 6 columns. If you need use high zoom, small screens (phones) or assistive technology there’s a potential to “get lost”. Imagine reading a table one cell at a time and having to scroll side-to-side and up and down on your phone. These tables are better attached to your report as .CSV format.
Labelling your table
Caption your table and prefix with Table X:
Use a designated header row for your table. Choosing a header row means that screen readers can communicate that about the table. Header row has been added to the table style in our report template and should apply automatically. If it doesn’t happen you can do this manually.
To choose a row as a header:
- select the row you want to change
- right-click and choose Table Properties
- select the Row tab and check ’Repeat as header row’
Check a tables accessibility
Try navigating all the way through using only the Tab key. If you can navigate through the table this way - cell by cell and row by row - a screen reader should have no trouble with it.
![]() See video on the Microsoft website on how to make your tables accessible.
See video on the Microsoft website on how to make your tables accessible.
The research report should also include
Copyright information
All maps must include appropriate copyright acknowledgement. Below are examples of common copyright statements.
As with images please provide high-resolution files in .png format to the NatureScot project manager on submission of your final report.
Ordnance Survey
© Crown copyright [and database rights] 2025 OS 100017908
Getmapping and Bluesky International (digital aerial imagery) material
© Bluesky International Ltd. and Getmapping Plc. 2025
Oceanwise material
© Crown Copyright, 2025. All rights reserved. Licence No. EK001-20140401. Not to be used for navigation.
Shetland mapping requirement
Under the Islands (Scotland) Act 2018, the Shetland Islands must be displayed in a manner that accurately and proportionately represents their geographical location in relation to the rest of Scotland. The Shetland Islands should not be placed in a box.
Accessible references
We chose to use Harvard referencing for referencing sources in our reports, with few tweaks to make it more accessible. A short guide on how to reference is provided below. Include all references from your report in References section at the end of your report in alphabetical order. Please don’t add indents or hanging paragraphs. Footnotes are not accessible and difficult to recreate in html. Avoid using them. Use ‘and’ instead of ‘&’ in references.
Hyperlinks should be embedded within meaningful text, for example title of the publication.
Harvard referencing
It is essential to give references whenever you use ideas, images or information that come from someone else.
Using quotations
When quoting from a source, use the author’s exact words. You should put these words inside quotation marks and include the key information:
- the author’s last name
- the year of publication
- the number of the page that the quote comes from.
If the author’s name is part of your sentence, it does not go inside the brackets. For example:
Russel et al. (2019, p. 35) claims ‘the exponential rate of increase in grey seal pup production in the southern North Sea must, in part, be driven by recruitment of females born elsewhere’.
If the author’s name is not part of your sentence, it goes inside the brackets. For example:
It has been suggested that ‘the exponential rate of increase in grey seal pup production in the southern North Sea must, in part, be driven by recruitment of females born elsewhere’ (Russel et al., 2019, p. 35).
Paraphrasing or summarising
If you summarise or paraphrase (put into your own words) what the author says, you do not need to use quotation marks, but you must include the key information (the author’s surname and the year of publication). For example:
Thompson et al. (2019) carried out a trend analyses for harbour seal SACs using data collected from 1990 to 2017.
Or
A trend analyses for harbour seal SACs was carried out using data collected from 1990 to 2017 (Thompson et al., 2019)
Multiple authors
If there are two authors, you should list both in your text and reference list.
Similarly, if there are three authors, all three should be listed in the text and reference list.
If there are four or more authors, use only the first surname followed by et al. in your text.
Citing multiple sources
If you include more than one reference for the same point, list them all in brackets, earliest first, and separate by semicolons. For example:
The primary estimate of the UK grey seal population size is based largely on pup counts carried out during the autumn and in early winter (Russell et al., 2019; Thomas et al., 2019).
Books
Author/editor’s surname, Initial. Year of publication. Title of book, edition. Place of publication: Name of publisher.
For example:
Kaiser, M.J., Attrill, A.J., Jennings, S., Thomas, D., Barnes, D.K.A., Brierly, A.S., Graham, N.A.J., Geert Hiddink, J.G., Howell, K.L. and Kaartokallio, H. 2020. eds. Marine ecology: processes, systems, and impacts, 3rd edition. Oxford: Oxford University Press.
Chapters in edited books
Author’s surname, Initial. Year of publication. Title of chapter. In: Initial and surname/s of editor/s, ed. Year of publication. Title of book. Place of publication: Name of publisher, page numbers of chapter.
For example:
Hammond, P.S. 2010. Estimating abundance of marine mammals. In: I.L. Boyd, W.D. and Bowen, S.J. Iverson, ed. 2010. Marine mammal ecology and conservation: a handbook of techniques. Oxford: Oxford University Press, pp. 42–67.
Journal articles
Author’s surname, Initial. Year of publication. Title of article. Title of journal, volume number (issue), page numbers.
Please spell out name of the journal in full rather than using an abbreviation. This will make it more accessible to those who rely on a screen reader.
Some journal articles may have a doi identification number. You can embed the doi link within the title of the article.
Russell, D.J.F., Morris, C.D., Duck, C.D., Thompson, D. and Hiby, L. 2019. Monitoring long‐term changes in UK grey seal pup production. Aquatic Conservation: Marine Freshwater Ecosystems, 29(S1), 24–39.
Websites and reports published online
Author’s surname, Initial or Name of organisation. Year published or last updated. Title of report or website.
It is not necessary to include date accessed for websites and online publications. Any out-of-date urls will be removed.
For example:
Morris, C.D., Duck, C.D. and Thompson, D. 2021. Aerial surveys of seals in Scotland during the harbour seal moult, 2016-2019. NatureScot Research Report 1256.
Where a publication or a website doesn’t have a clear publication date use abbreviation n.d. to indicate this.
For example:
NatureScot, n.d. Seals.
Document downloads
Last updated:
Contacts
Research