Scottish Biodiversity Indicator – The numbers and breeding success of seabirds (1986 to 2023)
Published: April 2025
Scotland’s breeding seabirds are of international importance. Seabirds are useful and important indicators for assessing the state of the marine environment (Parsons et al. 2008). Although they rely on the sea for much of their foraging, breeding on land makes them relatively easy to monitor. They respond to a range of factors such as changes in food availability, weather, predation, invasive species, disease and pollution. Being relatively long-lived the numbers of breeding seabirds usually change slowly over time. Breeding success (the number of chicks produced) provides an indication of food availability (generally fish and other marine species) and other factors such as predation during the breeding season. Breeding success typically varies far more from year to year than overall breeding numbers.
Monitoring Scotland’s Seabirds
The indicator is based on breeding numbers for 11 species, and breeding success for 12 species, (totalling 16 species, out of the 24 that breed in Scotland). The results are estimates from a representative sample of seabird colonies around Scotland, monitored as part of the UK Seabird Monitoring Programme (SMP), which started in 1986.
Indicator Assessment
From the start of the time series in 1986 to the most recent estimate in 2023:
- The mean numbers of 11 species of breeding seabirds in Scotland declined from 1986 to 2010, and has since somewhat stabilised. By 2023, breeding numbers were 48% of the 1986 level.
- Mean breeding success of 12 seabird species has fluctuated. In 2023, it was similar to the long-term average of 75% of the 1986 level.
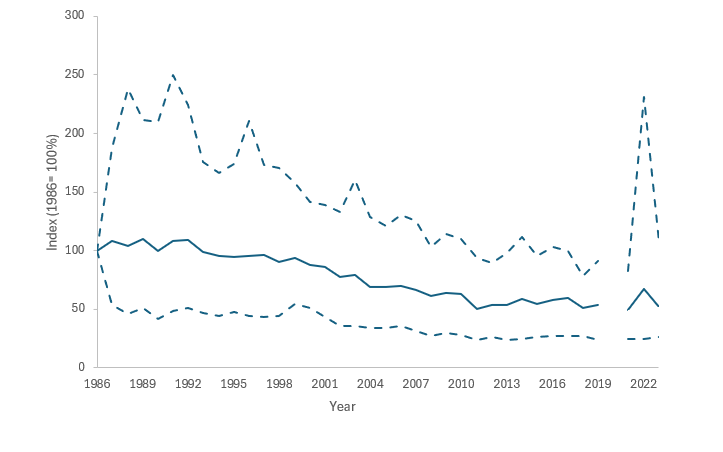
Figure 1. Seabird breeding numbers (1986 to 2023) across 11 species. The solid line is the index mean with the dashed line showing the 95% confidence limits. NOTE – No data for 2020 due to covid-based fieldwork restrictions.
Click for a full description
Figure 1 shows seabird breeding numbers between 1983 and 2023 across 11 species. The y-axis is titled Index (1986=100%) and ranges from 0 to 300 at intervals of 50. The x-axis shows years from 1986 to 2022 labelled every 3 years. There are 3 lines, 1 solid line in the middle representing the index mean and a dashed line above and below this showing the 95% confidence limits. The breeding numbers reported per annum varied but remained relatively stable with a continuous downward trend from around 100 index mean in 1986 to around 60 it 2019, with a gap during 2020 which held no data due to covid-based field restrictions. Following the no data in 2020 there is an increase in breeding numbers during 2022.
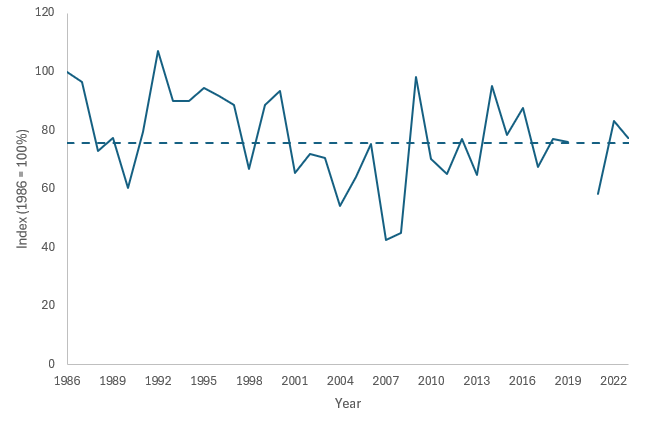
Figure 2. Seabird breeding success in Scotland (1986 to 2023) across 12 species. The dashed line shows the long-term average breeding success combined for all 12 species (1986 to 2022). NOTE – No data for 2020 due to covid-based fieldwork restrictions
Click for a full description
Figure 2 shows seabird breeding success in Scotland between 1986 and 2023 across 12 species. The y-axis is labelled index (1986=100%) and ranges from 0 to 120 at intervals of 20, the x-axis is labelled year and shows the years 1986 to 2022 at intervals of 3 years. There is a solid line indicating the number of seabird breeding successes in Scotland across 12 species which fluctuates between 105 at its highest in 1992 and 40 at its lowest in 2007, each year shows a fluctuation with no clear up or downward trend with a dashed line showing the long-term average breeding success combined for all 12 species which sits just below the 80 mark. There is a gap showing no data in 2020 due to covid-based fieldwork restrictions.
Reasons for Change
Overall Scotland’s seabirds have declined since 1986. The key drivers of change are food availability, invasive non-native species and climate change. The shortage of prey species, in particular sandeels, through direct take from fisheries or lower availability from increased sea temperatures can impact breeding success regionally (Burnell et al., 2023). Invasive non-native species have a direct impact on populations by predating some adult seabird species (Burnell et al., 2023), as well as eggs and chicks of mainly ground nesting birds. Climate change also has direct effects through extreme weather events, such as strong wind, which can affect seabirds’ ability to feed. If this occurs during the breeding season it can affect their breeding success. Outside the breeding season extreme weather events can lead to seabird wrecks (Burton et al., 2023). Some species such as shags can be particularly susceptible to these and research has shown how wrecks affect breeding numbers (Harris et al., 1998). To a lesser extent, pollutants and offshore renewables may present some threats to seabirds (e.g. Furness et al., 2012). For some species, for example great skua, disease (specifically highly pathogenic avian influenza) has also played a role in declines (Camphuysen et al. 2022, Tremlett et al. 2025). Work to develop the Scottish Seabird Conservation Action Plan (SSCAP) has summarised the vulnerability seabird species have to the pressures and threats that Scotland’s seabirds face (Scottish Government, 2024). Work on the SSCAP is in progress and, as it develops, it will help secure the future for Scotland’s seabirds. Long-term monitoring coupled with advances in technology to improve our understanding of seabird trends and identifying key areas used by seabirds for feeding is vital.
Breeding Numbers
Out of the 11 species assessed for breeding numbers from 1986 to 2023, all seabird species showed declines. Arctic skua continues to show the largest declines (83%) (see Table 1). Reductions in the availability of sandeels and the effects this has upon species such as black-legged kittiwake is understood to be one to the main factors affecting Arctic skua (Perkins et al. 2018). Increased predation from great skuas has also been linked to Arctic skua decline (Dawson et al. 2011). More recently studies looking into migration routes and wintering areas are revealing differences in population trends which may help guide future research and conservation actions (O’Hanlon et. al. 2024). The short-term trends for a few of our seabirds appear to be stabilising at lower levels than the 1986 baseline year. Reasons for short-term stabilisations in some species, such as fulmar and herring gull, may be complex but may relate to changes in previously abundant food supplies and associated changes in fisheries discards (Darby et al. 2023; Foster et al. 2017).
| Species | % Change in numbers (1986- 2023) | Long-term trend | %Change in numbers (2013 -2023) | Short-term trend |
|---|---|---|---|---|
| Arctic Skua | -83 | Decrease | 1 | Stable |
| Arctic Tern | -49 | Decrease | -21 | Decrease |
| Black Guillemot | -38 | Decrease | -15 | Decrease |
| Black-legged Kittiwake | -53 | Decrease | 22 | Increase |
| Common Gull (coastal) | -19 | Decrease | -6 | Decrease |
| Common Tern | -41 | Decrease | -34 | Decrease |
| European Shag | -14 | Decrease | 37 | Increase |
| Great Black-backed Gull | -72 | Decrease | -14 | Decrease |
| Guillemot | -9 | Decrease | 18 | Increase |
| Herring Gull (natural-nesting) | -53 | Decrease | -4 | Stable |
| Northern Fulmar | -42 | Decrease | 4 | Stable |
Breeding success
Breeding numbers typically change more slowly than breeding success and looking at breeding success helps us understand some of the immediate factors that cause changes in seabird numbers, such as food availability, weather events and predation. The 2023 results show that breeding success was around the long-term average. There was a mixed picture across the 12 species assessed. Four species (Arctic skua, black-legged kittiwake, European shag and little tern) had higher than average breeding success. Five species had lower than average breeding success (Atlantic puffin, common tern, guillemot, northern fulmar and northern gannet). Three species had breeding success around the average (Arctic tern, great skua and razorbill).
| Species | 2023 Breeding Success | Average Breeding Success | Difference |
|---|---|---|---|
| Arctic Skua | 0.58 | 0.32 | Higher |
| Black-legged Kittiwake | 0.71 | 0.62 | Higher |
| European Shag | 1.35 | 1.31 | Higher |
| Little Tern | 0.50 | 0.30 | Higher |
| Arctic Tern | 0.18 | 0.18 | Same |
| Great Skua | 0.44 | 0.45 | Same |
| Razorbill | 0.52 | 0.53 | Same |
| Atlantic Puffin | 0.45 | 0.57 | Lower |
| Common Tern | 0.45 | 0.47 | Lower |
| Guillemot | 0.38 | 0.59 | Lower |
| Northern Fulmar | 0.35 | 0.42 | Lower |
| Northern Gannet | 0.59 | 0.67 | Lower |
Source data and updates
The indicator has been updated with data up to and including 2023. The trend for breeding numbers is based on 11 species and the breeding success trend on the 12 species for which sufficient data are available. Data are derived from the UK Seabird Monitoring Programme (SMP) and its partners. The SMP collects and collates data on breeding numbers, demographic parameters (including breeding success and survival rate), and diet from a sample of colonies around the UK. Seabirds Count was published in 2023, this has improved our confidence in the trends produced. The census provides an accurate snapshot of seabird breeding numbers and allows us to benchmark the annual colony counts. A baseline of 1986 is used as it is widely considered the most robust and appropriate baseline with which to compare seabirds trends against. Systematic data collection has occurred since then. Earlier seabird counts data do exist for some of the indicator species, but coverage was not as complete and in some cases the survey methodology was not as robust as is practiced now. The late 1980s are thought to be a time period within which many seabird species were thriving.
Updates are provided annually and the data are available from BTO through the Seabird Monitoring Programme. The next update will be available in 2025.
UK Indicators
JNCC reports on seabird population trends as an Official Statistic. As Scotland supports the majority of UK breeding seabirds, the UK trend is heavily influenced by trends in Scotland. Seabird abundance in the UK increased between 1970 and 1999 and has since declined.
List of species contributing to the Indicators
| Species (link to JNCC SMP) | Breeding Numbers | Number of sites | Breeding Success | Number of sites |
|---|---|---|---|---|
| Arctic Skua | Yes | 263 | Yes | 2 |
| Arctic Tern | Yes | 88 | Yes | 9 |
| Atlantic Puffin | No | - | Yes | 7 |
| Black Guillemot | Yes | 15 | No | - |
| Black-legged Kittiwake | Yes | 77 | Yes | 42 |
| Common Gull (coastal) | Yes | 68 | No | - |
| Common Tern | Yes | 32 | Yes | 4 |
| European Shag | Yes | 94 | Yes | 29 |
| Great Black-backed Gull | Yes | 226 | No | - |
| Great Skua | No | - | Yes | 4 |
| Guillemot | Yes | 86 | Yes | 14 |
| Herring Gull (natural-nesting) | Yes | 124 | No | - |
| Little Tern | No | - | Yes | 3 |
| Northern Fulmar | Yes | 129 | Yes | 28 |
| Northern Gannet | No | - | Yes | 7 |
| Razorbill | No | - | Yes | 13 |
Summary of species-specific trends
The below figures 4 to 25 present the species trends for breeding numbers and/or breeding success, depending on the data available per species (as per Table 3 – list of species table reference).
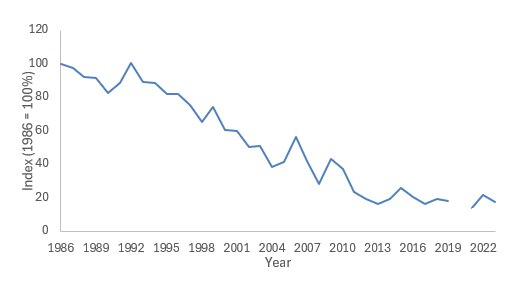
Figure. 3. Arctic Skua – Breeding Numbers
Click for a full description
Figure 3 displays breeding numbers for Arctic Skua between the years 1986 and 2022. The y-axis is labelled Index (1986=100%) and ranges from 0 to 120 at intervals of 20, the x-axis shows years 1986 to 2022 at intervals of 3 years. The numbers of Arctic Skua fluctuates but shows a clear downward trend starting from 100 in 1986 going down to a low of about 20 in 2022. There is a gap in 2020 with no data due to covid-based field restrictions.
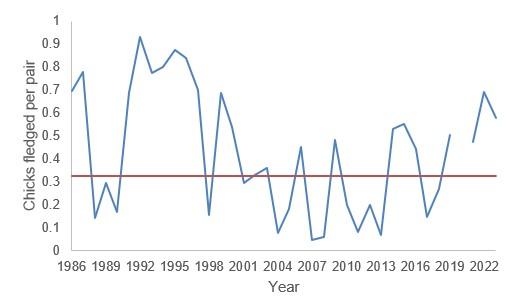
Figure 4. Arctic Skua – Breeding Success
Click for a full description
Figure 4 displays breeding success for Arctic Skua between the years 1986 and 2022. The y-axis is labelled ‘Chicks fledged per pair’ ranging from 0 to 1 at intervals of 0.1, the x-axis shows the years 1986 to 2022 at intervals of 3 years. There is a solid line representing breeding success which fluctuates markedly with no clear up or downward trend. The highest recorded chicks fledged per pair sits just above 0.9 in 1992 and is at its lowest of 0.05 in 2007 but the rate varies across the years. There is a solid horizontal line showing the long-term average chicks fledged per pair which sits just above 0.3. There is a gap in 2020 with no data due to covid-based field restrictions.
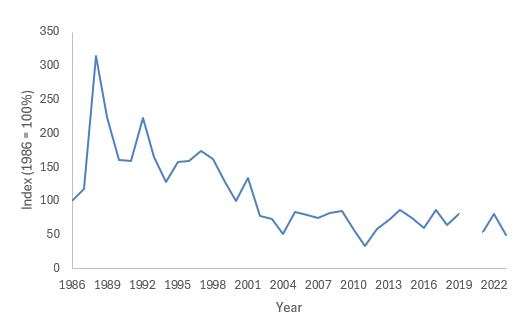
Figure 5. Arctic Tern – Breeding numbers
Click for a full description
Figure 5 displays breeding numbers for Arctic Tern between the years 1986 and 2022. The y-axis is labelled Index (1986=100%) and ranges from 0 to 350 at intervals of 50, the x-axis shows years 1986 to 2022 at intervals of 3 years. The graph displays a general downward trend starting at 100 in 1986, making a sharp rise to 300 in 1988 before trending downwards albeit with some fluctuations, reaching a low of around 35 in 2010, and ranging between around 50 and 90 thereafter. There is a gap in 2020 with no data due to covid-based field restrictions.
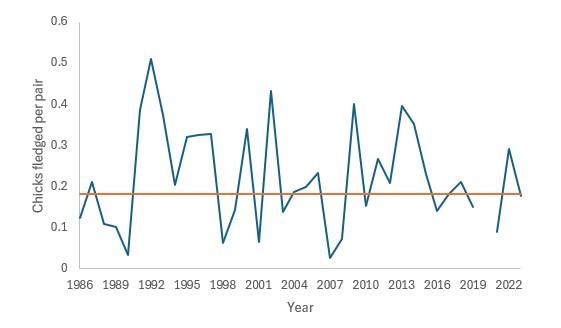
Figure 6. Arctic Tern – Breeding success
Click for a full description
Figure 6 displays breeding success for Arctic Tern between the years 1986 and 2022. The y-axis is labelled ‘Chicks fledged per pair’ ranging from 0 to 0.6 at intervals of 0.1, the x-axis shows the years 1986 to 2022 at intervals of 3 years. There is a solid line representing the chicks fledged per pair which fluctuates markedly with no clear up or downward trend. The graph shows a great deal of variance across the years with a high of 0.5 chicks fledged per year in 1992 and a low of 0.02 in 2007, there is a solid horizontal line which represents the long-term average breeding success sitting just below 0.2. There is a gap in 2020 with no data due to covid-based field restrictions.
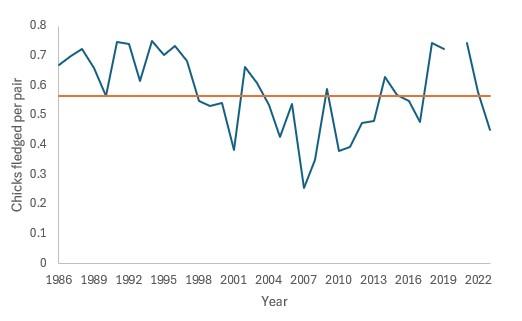
Figure 7. Atlantic Puffin – breeding success
Click for a full description
Figure 7 displays breeding success for Atlantic Puffin between the years 1986 and 2022. The y-axis is labelled ‘Chicks fledged per pair’ ranging from 0 to 0.8 at intervals of 0.1, the x-axis shows the years 1986 to 2022 at intervals of 3 years. There is a solid line representing the chicks fledged per year which has some small fluctuations between a high of 0.75 in 1989 and a low of 0.25 in 2007, there is a solid horizontal line representing the long-term average breeding success which sits just below 0.6. There is a gap in 2020 with no data due to covid-based field restrictions.
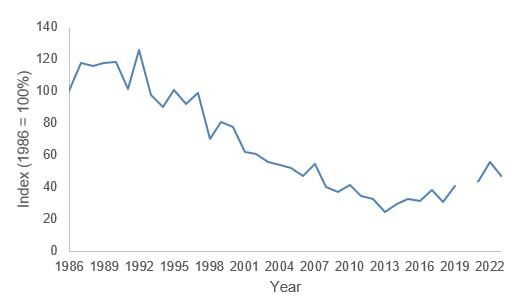
Figure 8. Black-legged Kittiwake – breeding numbers
Click for a full description
Figure 8 displays breeding numbers for Black-legged Kittiwake between the years 1986 and 2022. The y-axis is labelled Index (1986=100%) and ranges from 0 to 140 at intervals of 20, the x-axis shows years 1986 to 2022 at intervals of 3 years. There is a solid line which shows the breeding numbers and this fluctuates with an overall downward trend starting at 100 in 1986 before moving up to about 120 in 1993 before trending down to a low of around 20 in 2013. After this there is a gradual upward trend to a high of around 50 in 2022. There is a gap in 2020 with no data due to covid-based field restrictions.
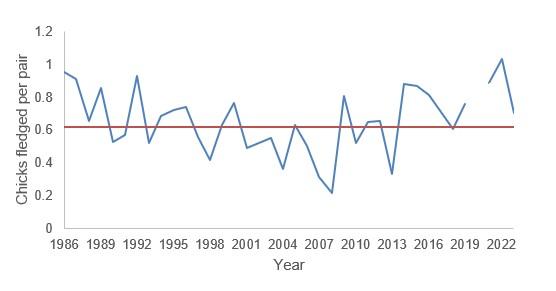
Figure 9. Black-legged Kittiwake – breeding success
Click for a full description
Figure 9 displays breeding success for Black-legged Kittiwake between the years 1986 and 2022. The y-axis is labelled ‘Chicks fledged per pair’ ranging from 0 to 1.2 at intervals of 0.2, the x-axis shows the years 1986 to 2022 at intervals of 3 years. There is a solid line which represents breeding success and fluctuates per year ranging between a high of about 1 in 2022 and a low of 0.2 in 2008. There is a solid horizontal line representing the long-term average breeding success which sits at 0.6. There is a gap in 2020 with no data due to covid-based field restrictions.
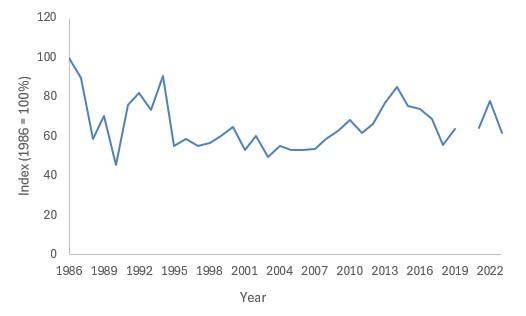
Figure 10. Black Guillemot – breeding numbers
Click for a full description
Figure 10 displays breeding numbers for Black Guillemot between the years 1986 and 2022. The y-axis is labelled Index (1986=100%) and ranges from 0 to 120 at intervals of 20, the x-axis shows years 1986 to 2022 at intervals of 3 years. There is a solid line representing the breeding numbers which fluctuates per year with no clear up or downward trend but with a high of 100 in 1986 and a low of 40 in 1990, before remaining relatively stable from 1995 to 2007 after which a slight upward trend is seen reaching a high of around 80 in 2013. There is a gap in 2020 with no data due to covid-based field restrictions.
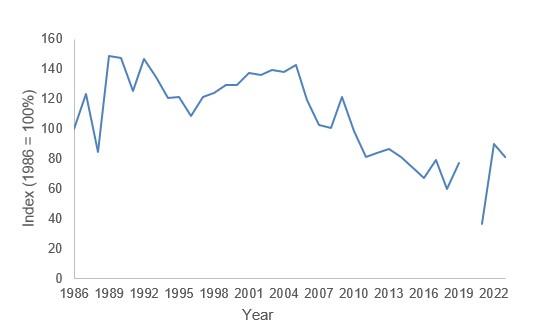
Figure 11. Common Gull – breeding numbers
Click for a full description
Figure 11 displays breeding numbers for Common Gull between the years 1986 and 2022. The y-axis is labelled Index (1986=100%) and ranges from 0 to 160 at intervals of 20, the x-axis shows years 1986 to 2022 at intervals of 3 years. There is a solid line showing the number of breeding Common Gulls fluctuating per year but remaining relatively stable until a downward trend can be seen starting in 2005 from around 140 and falling until 2021 to around 35 after which where a rise is seen back up to around 90. There is a gap in 2020 with no data due to covid-based field restrictions.
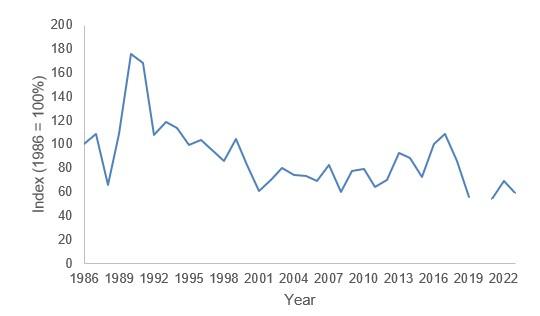
Figure 12. Common Tern – breeding numbers
Click for a full description
Figure 12 displays breeding numbers for Common Tern between the years 1986 and 2022. The y-axis is labelled Index (1986=100%) and ranges from 0 to 200 at intervals of 20, the x-axis shows years 1986 to 2022 at intervals of 3 years. There is a solid line showing the breeding numbers which fluctuates per year starting at 100 in 1986 and rising to a high of roughly 175 in 1990 before trending down to a low of about 60 in 2008, a gradual rise is seen up to around 110 in 2017 before falling again. There is a gap in 2020 with no data due to covid-based field restrictions.
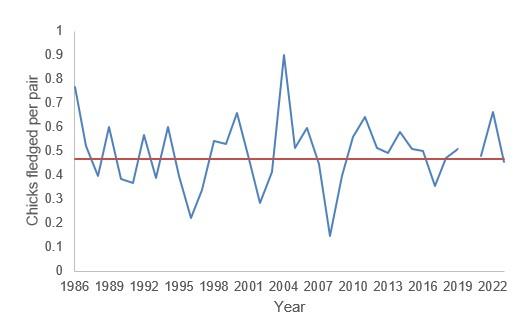
Figure 13. Common Tern – breeding success
Click for a full description
Figure 13 displays breeding success for Common Tern between the years 1986 and 2022. The y-axis is labelled ‘Chicks fledged per pair’ ranging from 0 to 1 at intervals of 0.1, the x-axis shows the years 1986 to 2022 at intervals of 3 years. There is a solid fluctuating line showing the breeding success which varies per year with no clear up or downward trend, with a high of 0.9 in 2004 and a low of 0.15 in 2008. There is a solid horizontal line showing he long-term average breeding success which sits around 0.47. There is a gap in 2020 with no data due to covid-based field restrictions.
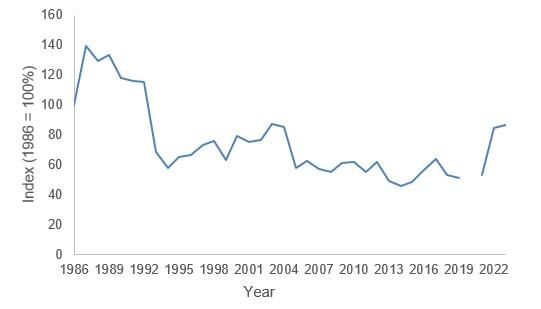
Figure 14. European Shag – breeding numbers
Click for a full description
Figure 14 displays breeding numbers for European Shag between the years 1986 and 2022. The y-axis is labelled Index (1986=100%) and ranges from 0 to 160 at intervals of 20, the x-axis shows years 1986 to 2022 at intervals of 3 years. There is a solid line which displays the fluctuations of breeding numbers from a high of 140 in 1987 to a low of 45 in 2014. The graph generally trends downwards with a steep drop around 1992 before remaining relatively stable, before a rise to around in 85 in 2021 and 2022. There is a gap in 2020 with no data due to covid-based field restrictions.
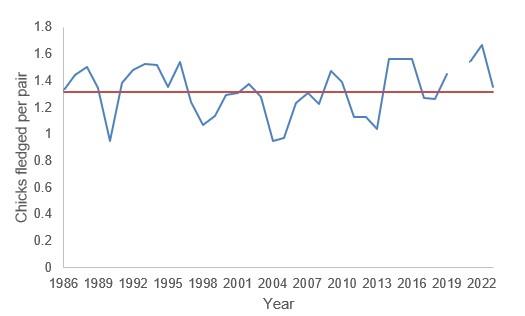
Figure 15. European Shag – breeding success
Click for a full description
Figure 15 displays breeding success for European Shag between the years 1986 and 2022. The y-axis is labelled ‘Chicks fledged per pair’ ranging from 0 to 1.8 at intervals of 0.2, the x-axis shows the years 1986 to 2022 at intervals of 3 years. There is a solid line showing the fluctuations of breeding success with no clear up or downward trend but with variance per year going up or down from a high of 1.6 in 2022 and a low of 0.9 in 2004. There is a horizontal line which displays the long-term average breeding success across the years which sits at 1.3. There is a gap in 2020 with no data due to covid-based field restrictions.
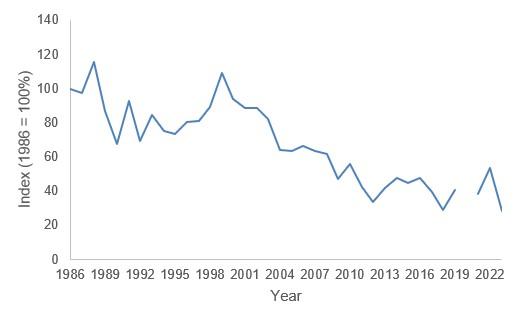
Figure 16. Great Black-backed Gull – breeding numbers
Click for a full description
Figure 16 displays breeding numbers for Great Black-backed Gull between the years 1986 and 2022. The y-axis is labelled Index (1986=100%) and ranges from 0 to 140 at intervals of 20, the x-axis shows years 1986 to 2022 at intervals of 3 years. There is a solid line showing fluctuations of breeding numbers with an overall downward trend starting from a high of around 115 in 1987 and falling to a low of around 20 in 2018 with a brief peak of 105 in the year 2000. There is a gap in 2020 with no data due to covid-based field restrictions.
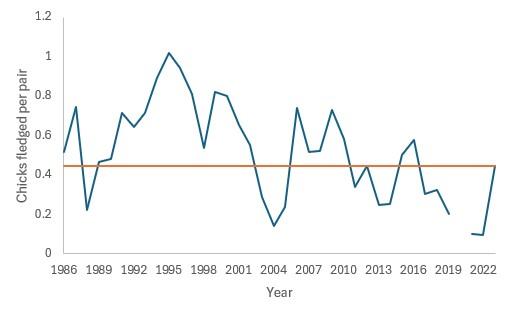
Figure 17. Great Skua – breeding success
Click for a full description
Figure 17 displays breeding success for Great Skua between the years 1986 and 2022. The y-axis is labelled ‘Chicks fledged per pair’ ranging from 0 to 1.2 at intervals of 0.2, the x-axis shows the years 1986 to 2022 at intervals of 3 years. There is a solid line showing the fluctuations of breeding success with a slight trend downward after a rise from 0.2 in 1988 to 1 in 1995 before dropping again to 0.1 in 2004, success fluctuates again rising to 0.7 in 2007 and falling to a low of below 0.1 in 2022. There is a horizontal line representing long-term average trends across the years sitting just above 0.4. There is a gap in 2020 with no data due to covid-based field restrictions.
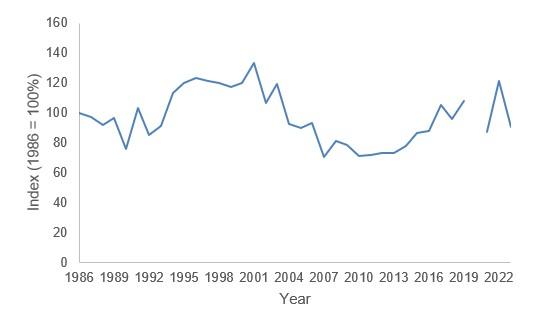
Figure 18. Common Guillemot – breeding numbers
Click for a full description
Figure 18 displays breeding numbers for Common Guillemot between the years 1986 and 2022. The y-axis is labelled Index (1986=100%) and ranges from 0 to 160 at intervals of 20, the x-axis shows years 1986 to 2022 at intervals of 3 years. There is a solid line showing fluctuations of breeding numbers with no clear up or downward trend, starting at 100 in 1986 and rising to a peak of 130 in 2001 before falling to a low of 70 in 2007 and then starting to rise again. There is a gap in 2020 with no data due to covid-based field restrictions.
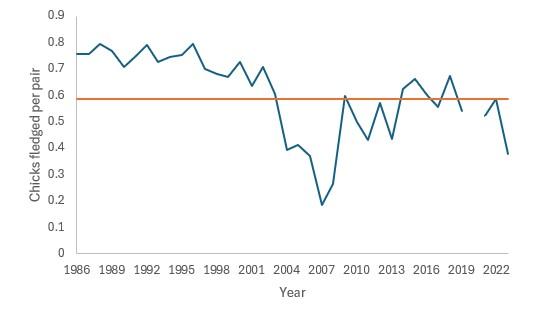
Figure 19. Common Guillemot – breeding success
Click for a full description
Figure 19 displays breeding success for Common Guillemot between the years 1986 and 2022. The y-axis is labelled ‘Chicks fledged per pair’ ranging from 0 to 0.9 at intervals of 0.2, the x-axis shows the years 1986 to 2022 at intervals of 3 years. There is a solid line showing the fluctuations of breeding success starting at a high of 0.76 in 1986 and remaining stable until falling in 2002 to a low of 0.15 in 2007, before rising sharply again to around 0.6 in 2009 and remaining relatively stable. There is a horizontal line representing long-term average trends across the years sitting just below 0.6. There is a gap in 2020 with no data due to covid-based field restrictions.
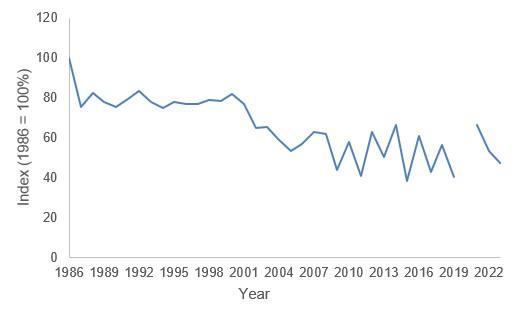
Figure 20. Herring Gull – breeding numbers
Click for a full description
Figure 20 displays breeding numbers for Herring Gull between the years 1986 and 2022. The y-axis is labelled Index (1986=100%) and ranges from 0 to 120 at intervals of 20, the x-axis shows years 1986 to 2022 at intervals of 3 years. There is a solid line showing fluctuations in breeding numbers showing a gradual downward trend starting from a high of 100 in 1986 and falling to a low of about 40 in 2015. There is a gap in 2020 with no data due to covid-based field restrictions.
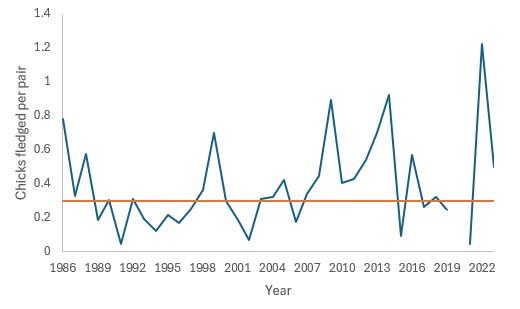
Figure 21. Little Tern – breeding success
Click for a full description
Figure 21 displays breeding success for Little Tern between the years 1986 and 2022. The y-axis is labelled ‘Chicks fledged per pair’ ranging from 0 to 1.4 at intervals of 0.2, the x-axis shows the years 1986 to 2022 at intervals of 3 years. There is a solid line showing fluctuations of breeding success with no clear up or downward trend with some large fluctuations between years, with a peak between 1997 and 2000 with numbers rising to 0.7 from 0.2 and then dropping back to below 0.1. There is also a sharp rise from just above 0 in 2021 to a high of 1.2 in 2022. There is a horizontal line representing the long-term average breeding success which sits at 0.3. There is a gap in 2020 with no data due to covid-based field restrictions.
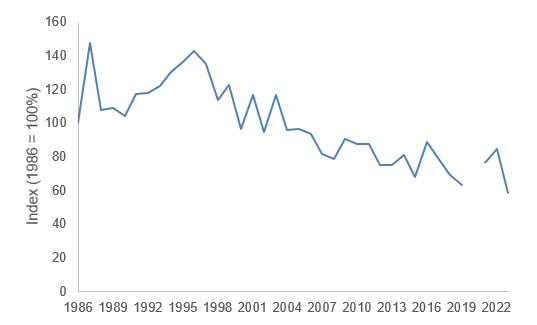
Figure 22. Northern Fulmar – breeding numbers
Click for a full description
Figure 22 displays breeding numbers for Northern Fulmar between the years 1986 and 2022. The y-axis is labelled Index (1986=100%) and ranges from 0 to 160 at intervals of 20, the x-axis shows years 1986 to 2022 at intervals of 3 years. There is a solid line showing the fluctuations of breeding numbers with a clear downward trend starting from a high of 145 in 1987 and trending downwards to a low of around 60 in 2023. There is a gap in 2020 with no data due to covid-based field restrictions.
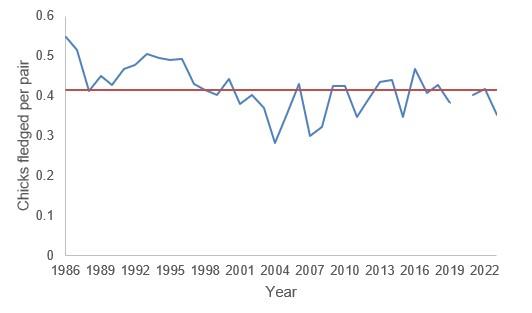
Figure 23. Northern Fulmar – breeding success
Click for a full description
Figure 23 displays breeding success for Northern Fulmar between the years 1986 and 2022. The y-axis is labelled ‘Chicks fledged per pair’ ranging from 0 to 0.6 at intervals of 0.2, the x-axis shows the years 1986 to 2022 at intervals of 3 years. There is a solid line showing the fluctuations of breeding success that remain relatively stable with a high of 0.55 in 1986 and a low of just below 0.3 in 2004. There is a horizontal line which represents long-term average breeding success which sits just above 0.4. There is a gap in 2020 with no data due to covid-based field restrictions.
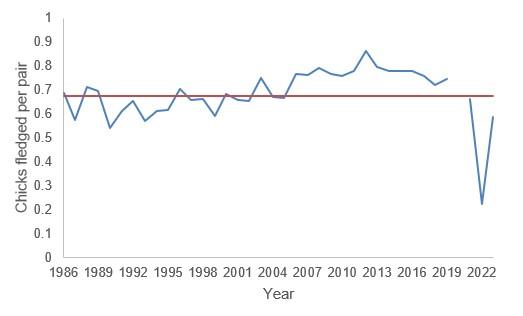
Figure 24. Northern Gannet – breeding success
Click for a full description
Figure 24 displays breeding success for Northern Gannet between the years 1986 and 2022. The y-axis is labelled ‘Chicks fledged per pair’ ranging from 0 to 1 at intervals of 0.2, the x-axis shows the years 1986 to 2022 at intervals of 3 years. There is a solid line showing the fluctuations of breeding success with a slight upward trend starting in 1986 at 0.7 and rising to 0.85 in 2013 before a sharp fall to reach a low of 0.2 in 2022. There is a horizontal line representing the long-term average breeding success which sits just below 0.7. There is a gap in 2020 with no data due to covid-based field restrictions.
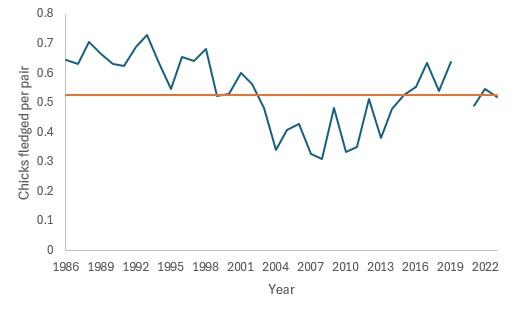
Figure 25. Razorbill – breeding success
Click for a full description
Figure 25 displays breeding success for Razorbill between the years 1986 and 2022. The y-axis is labelled ‘Chicks fledged per pair’ ranging from 0 to 0.8 at intervals of 0.2, the x-axis shows the years 1986 to 2022 at intervals of 3 years. There is solid line showing the fluctuations of breeding success which with a downward trend starting in 1986 at 0.63 and falling to a low of 0.3 in 2008 before trending upwards to about 0.6 in 2017. There is a horizontal line representing the long-term average breeding success which has remained stable at just about 0.5. There is a gap in 2020 with no data due to covid-based field restrictions.
References
Burnell, D., Perkins, A.J., Newton, S.F., Bolton, M., Tierney, T.D. & Dunn, T.E., 2023. Seabirds Count: a census of breeding seabirds in Britain and Ireland (2015-2021). Lynx Nature Books, Barcelona.
Burton, N.H.K., Daunt, F., Kober, K., Humphreys, E.M. and Frost, T.M., 2023. Impacts of climate change on seabirds and waterbirds in the UK and Ireland.
Camphuysen, C.J., Gear, S.C. and Furness, R.W., 2022. Avian influenza leads to mass mortality of adult Great Skuas in Foula in summer 2022. Scott. Birds, 42, pp.312-323.
Dawson, N.M., Macleod, C.D., Smith, M. and Ratcliffe, N., 2011. Interactions with Great Skuas Stercorarius skua as a factor in the long‐term decline of an Arctic Skua Stercorarius parasiticus population. Ibis, 153(1), pp.143-153.
Foster, S., Swann, R.L., and Furness, R.W. 2017. Can changes in fishery landings explain long-term population trends in gulls? Bird Study, 64, 90-97.
Furness, R.W., Wade, H.M., Robbins, A.M. and Masden, E.A., 2012. Assessing the sensitivity of seabird populations to adverse effects from tidal stream turbines and wave energy devices. ICES Journal of Marine Science, 69(8), pp.1466-1479.
Harris, M.P., Wanless, S. and Elston, D.A. (1998) Age-related effects of a non-breeding event and a winter wreck on the survival of shags Phalacrocorax aristotelis. Ibis, 140, 310–314.
O’Hanlon, N.J., van Bemmelen, R.S., Conway, G.J., Thaxter, C.B., Aiton, H., Aiton, D., Balmer, D.E., Calladine, J.R., Harris, S.J. and Humphreys, E.M., 2024. New insights into the migration and wintering areas of Scottish-breeding Arctic Skuas. British Birds.
Parsons, M., Mitchell, I., Butler, A., Ratcliffe, N., Frederiksen, M., Foster, S., and Reid, J. B. 2008. Seabirds as indicators of the marine environment. ICES Journal of Marine Science, 65, 1520-1526.
Perkins, A., Ratcliffe, N., Suddaby, D. Ribbands, B., Smith, C., Ellis, P., Meek, E., and Bolton, M. 2018.Combined bottom‐up and top‐down pressures drive catastrophic population declines of Arctic skuas in Scotland. Journal of Animal Ecology. 87, 1573-1586.
Ratcliffe, N. 2004. Common Tern in Seabird Populations of Britain and Ireland: results of the Seabird 2000 Census (1998-2002). P. Ian Mitchell, Stephen F. Newton, Norman Ratcliffe and Timothy E. Dunn (Eds.). Published by T and A.D. Poyser, London.
Scottish Government, 2024. The Scottish Seabird Vulnerability Report, Dec 2024, Accessed at https://www.gov.scot/publications/scottish-seabird-conservation-action-plan-vulnerability-report/
Tremlett, C. J., Cleasby, I. R., Bolton, M., & Wilson, L. J. (2025). Declines in UK breeding populations of seabird species of conservation concern following the outbreak of high pathogenicity avian influenza (HPAI) in 2021–2022. Bird Study, 1–18. https://doi.org/10.1080/00063657.2024.2438641
Last updated: