Scotland’s Natural Capital Asset Index – 2025 (data to 2022) Update summary
Contents
- Headline results and key messages
- Natural capital and a capitals approach
- What is the Natural Capital Asset Index?
- Natural capital and biodiversity
- Methodology
- Results
- Historic trends of the Natural Capital Asset Index
- A refresh of the Natural Capital Asset Index
- Scotland’s National Natural Capital Accounts
- Final notes and contact details
Headline results and key messages
Nature’s ability to provide services plateaus
- The Natural Capital Asset Index is an anthropocentric look at how well nature can contribute to people’s wellbeing through a range of ecosystem services and ecosystem characteristics. The Natural Capital Asset Index is designed to complement tools that measure the state of biodiversity, including reporting on species, habitats and genetic diversity within wild species.
- Over the short-term (2019 to 2022), natural capital is classed as being ‘maintained’. (note: it does not include an assessment of marine ecosystems).
- Between 2019 and 2022, the ability of agriculture and cultivated habitats to contribute to well-being improved. This change is largely driven by a decrease in fertiliser and pesticide use (note: this is measured by weight and not active ingredients)
- Woodland natural capital values are increasing, although this is largely driven by an increase in habitat area rather than an improvement in habitat quality. Overall woodland condition is poor. Habitat extent, woodland birds, and certified woodland are driving the increase in woodland natural capital values, overshadowing the overall poor site condition of Scottish woodlands.
- The indicators used to develop the NCAI are currently under review to be updated for future NCAI iterations. This update still uses the original indicators, of which 11 out of 38 are outdated.
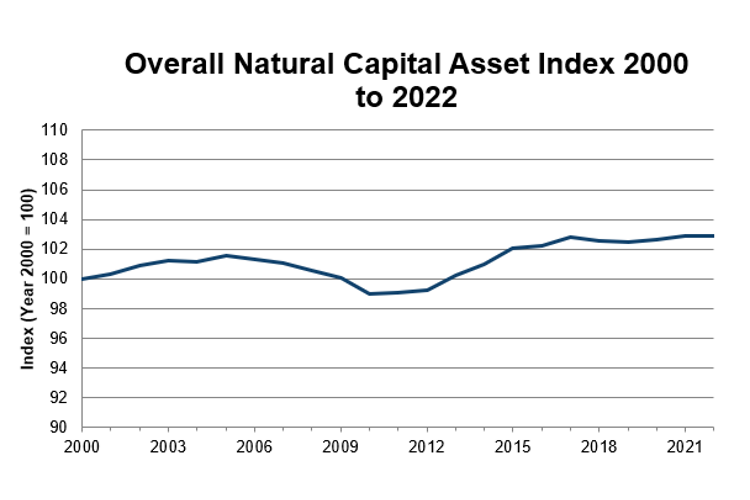
Figure 1: Overall Natural Capital Asset Index 2000 to 2022
Click for a full description
A graph showing the change in the Natural Capital Asset Index over time. The horizontal axis represents time in years between 2000 and 2022, the vertical axis is the relative ability of Scotland's natural environment to provide benefits to people
Natural capital and a capitals approach
Natural capital is made up of the environmental resources (e.g. plants, animals, air, water, soils) that combine to yield a flow of benefits to people. The range of benefits people can derive from natural capital can be understood as ecosystem services and are often grouped into three distinct categories:
- Provisioning services refer to material outputs we receive from nature, such as food and water for drinking
- Regulating services are ecological processes such as climate regulation and air pollution removal
- Cultural services include non-tangible contributions from nature such as aesthetics and recreation
Natural capital has historically been eroded by human activity, partly because it has not been properly valued when compared with other types of capital. Natural capital is one of four types of capital: social, human, financial, and natural. A capitals approach integrates these pieces that shape society together for a more equitable and holistic understanding of the drivers and impacts our choices, laying the groundwork for a wellbeing economy.
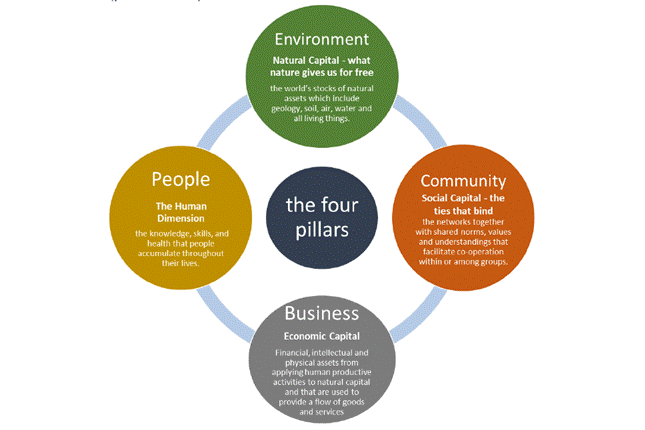
Figure 2: The four pillars of the four capitals approach
Click for a full description
Environment
Natural Capital - what nature gives us for free
The world's stocks of natural assets which include geology, soils, air, water and all living things.
People
The Human Dimension
The knowledge, skills and health that people accumulate throughout their lives.
Business
Economic Capital
Financial, intellectual and pysical assets from applying human productive acitivities to natural capital and that are used to provide a flow of goods and services.
Community
Social Capital - the tie that binds
The networks together with shared norms, values and understandings that facilitate co-operation within or amoung groups.
Natural capital is a way to represent and make sure nature is included in decision making and makes the invisible benefits and value of nature visible. The Natural Capital Asset Index is one tool to include nature in policy decisions where it historically has been overlooked, undervalued and unaccounted for.
What is the Natural Capital Asset Index?
The Natural Capital Asset Index (NCAI or the Index) helps us assess Scotland’s prosperity: it tracks the capacity of Scotland’s terrestrial ecosystems to provide the benefits that underpin our quality of life and that of future generations.
The NCAI is a composite index made of a range of datasets looking at the amount and characteristics of different Scottish habitats. It is not a monetary value but is composed in a way which reflects the relative contribution of habitats to the wellbeing, or quality of life, of those who live in Scotland. The capacity of ecosystems to provide benefits fluctuates over time due to changes in habitat quantity and quality.
Gaps remain in our understanding of the complexity of nature. While the NCAI is an indicator of terrestrial habitats’ contribution to wellbeing, it does not account for Scotland’s considerable marine habitats. A feasibility study for a marine version of the Index was conducted in 2019. The NCAI also does not demonstrate changes in biodiversity nor a habitat’s resilience to outside pressures. However, it does account for and acknowledges the importance of biodiversity for healthy and resilient ecosystems and the future delivery of benefits through a selection of bird and butterfly indicators.
The Index is a desk-based natural capital assessment at a national scale. It’s an anthropocentric understanding of nature; valuing the services nature provides as it relates to humans. As with any natural capital assessment, its best used in tandem with and to complement other indicators to fully understand the state of natural capital in Scotland. Many other pieces of work, such as the ecosystem health indicators can help round out our understanding.
Natural capital and biodiversity
Biodiversity is the bedrock of nature and Scotland’s natural capital. The function, resilience and ability of nature to provide benefits now and into the future are fundamentally reliant on the diversity of life – genes, species and ecosystems. The Scottish Biodiversity Strategy (SBS) envisions fully restored and regenerated biodiversity across Scotland by 2045, ensuring the flow of ecosystem services that our economy depends on now and in the future. Delivering this vision means embedding biodiversity and natural capital into policymaking. The NCAI is an instrument for policy delivery as an indicator for a thriving sustainable economy that conserves and grows its natural assets in the Environment Strategy’s Monitoring Framework as well as an economic indicator for sustainable development in the National Performance Framework.
In 2021, the UK’s HM Treasury released The Economics of Biodiversity: The Dasgupta Review, highlighting the importance of biodiversity for life and wellbeing on the planet and the need for change in the economic system to protect nature. The Review advocates for a natural capital approach, the same approach the NCAI takes, as a change indicator for overall stocks of natural capital and as a national wealth indicator demonstrating the contribution of nature to Scotland’s wellbeing. Natural capital approaches help guide the investment that is essential to achieve the SBS’s priority actions for 2030 and increase biodiversity and ecosystem service delivery.
Methodology
The NCAI uses ecosystem services to assess how nature contributes to the wellbeing of Scottish citizens. Four types of data inputs are used, including habitat extent, ecosystem service potential, Scotland’s demand for different ecosystem services and measurements of habitat quality, along with three types of weighting processes. More detail can be found in the Ecological Indicators journal article “Scotland’s natural capital asset index: Tracking nature’s contribution to national wellbeing.”
Habitat quantity is tracked using what we know about land cover change in Scotland. The following Scottish habitats are included in the NCAI:
- Woodland
- Inland surface waters
- Coastal
- Grasslands
- Mires, fens and bogs
- Heathland
- Agriculture and cultivated
Habitat quality is tracked using 38 separate indicators on ecosystem characteristics and condition which rely on datasets gathered by a range of public organisations and citizen science schemes. These datasets are listed at the end of the Results section. Each habitat delivers a unique and varied blend of benefits, as demonstrated below. The Index is set against a baseline year 2000 which is given the value 100.
The Index is continually improved as our understanding develops and efforts will continue to refine its methodology and data. In 2014, James Hutton Institute conducted a review of the NCAI methodology and its suite of habitat quality indicators. Outcomes from this review included transitioning the habitat extent classification from Broad Habitats to the European Nature Information System (EUNIS) land cover classification, and a refinement of the over 100 quality indicators to the current 38.
As a note, result comparisons for the NCAI are discussed as percentage points.
Results
Our measure of the potential of Scotland’s habitats to deliver ecosystem services has improved over the past 20 years and has now plateaued around its peak in 2017, as seen in Figure 2. The overall trend is currently 2.9 percentage points higher than 2000.
Over the short-term (2019 to 2022), the NCAI is officially classed as ‘maintaining’ using performance definitions published in the National Performance Framework where it is an economic indicator of sustainable development (+0.4 percentage points). This follows a deterioration in Scotland’s natural capital between the 1950s and 1990s, discussed more following the Results section.
Overall trends
- The Index remains stable (+0.4 percentage points from 2019). Because of natural and statistical variability in the underlying data and assumptions, these are marginal changes and are not statistically significant. Therefore, the Index is considered to be in a ‘maintaining’ state.
- The NCAI status using performance definitions in the National Performance Framework remains in a ‘maintaining’ state. An increase of 2 percentage points over 3 years is required for an ‘improving’ state.

Figure 3: Overall Natural Capital Asset Index 2000 to 2022
Click for a full description
A graph showing the change in the Natural Capital Asset Index over time. The horizontal axis represents time in years between 2000 and 2022, the vertical axis is the relative ability of Scotland's natural environment to provide benefits to people.
Results by type of ecosystem service
Regulating and maintaining and cultural ecosystem services reflect the trend of the overall NCAI with provisioning ecosystem services seeing a continuous gradual increasing trend.
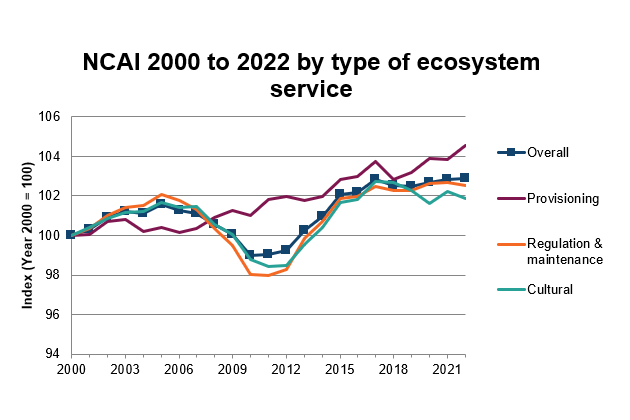
Figure 4: The Natural Capital Asset Index by type of ecosystem service 2000 to 2022
Click for a full description
A graph of the Natural Capital Asset Index broken down by the three types of ecosystem services: provisioning, regulating and maintaining, and cultural, with the overall trend included for comparison purposes, from 2000 to 2022. The horizontal axis represents time in years between 2000 and 2022, the vertical axis is the relative ability of Scotland's natural environment to provide benefits to people.
Provisioning ecosystem services
- Between 2019 and 2022, provisioning ecosystem services remained stable (+1.4 percentage points) but has increased 4.6 percentage points since 2000.
- Since 2000, provisioning services have fluctuated but seen a steadily increasing trend.
- The main habitats that drive provisioning ecosystem services are inland surface waters and agricultural land, with characteristics such as cereal yield and the number of livestock, as well as the quality of water.
Regulating and maintaining ecosystem services
- Regulating and maintaining ecosystem services have been stable between 2019 and 2022 (+0.3 percentage points) but have increased by 2.5 percentage points since 2000.
- Regulating and maintaining ecosystem services are the services that most drive the NCAI through the high demand and the full range of habitats performing these services.
- A concentration of indicators in grasslands and woodlands is likely to be driving the overall trend in regulating and maintaining ecosystem services, as both these ecosystems are heavily represented with quality indicators for these services. Woodland habitat has been increasing in ecosystem extent while grassland habitat has been declining in extent since 2010. Both habitat types have shown a recent decline in habitat condition.
Cultural ecosystem services
- Cultural ecosystem services are stable both over the short term (-0.4 percentage points from 2019) and long term (+1.9 percentage points since 2000).
- Cultural ecosystem services have the most even distribution of habitats and quality indicators. However, grasslands and woodlands habitats have the most influence with expanding ecosystem extent and highest number of quality indicators. Coastal habitats also contribute significantly to this category of ecosystem services.
Results by individual habitats
Between 2019 and 2022, agriculture & cultivated habitats have increased, likely due to decreased fertiliser use and increased habitat extent. Coastal, inland surface waters, woodland, grassland and mire, bogs and fens, and heathlands have remained stable (change is under 2 percentage points since 2019).
While woodland appears to have improved substantially since the baseline year this increase is largely due to an increase in woodland area (broadleaf woodland extent grew by 60 percentage points compared to year 2000 baseline), while woodland condition has decreased by 27 percentage points during this same period. This means that the growth of in the extent woodland habitat overshadows the overall declining quality of woodland in Scotland. It is important to use NCAI results in conjunction with appropriate context for each habitat type. All habitat trends are seen in Figure 4.
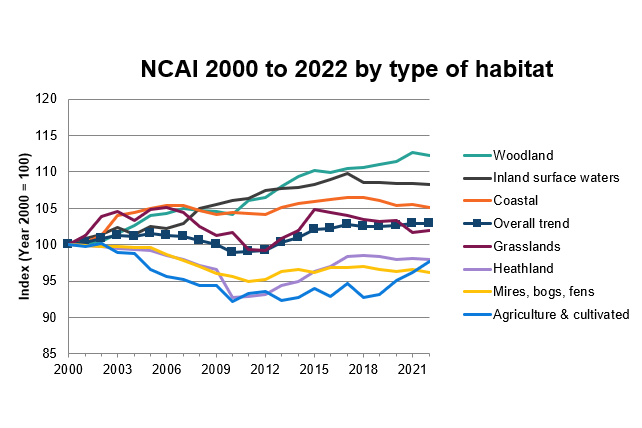
Figure 5: The Natural Capital Asset Index by type of habitat 2000 to 2022
Click for a full description
A graph of the Natural Capital Asset Index broken down into its constituent habitats: agriculture and cultivated, coastal, grassland, heathland, inland surface waters, mires, bogs and fens, and woodland, with the overall trend included for comparison purposes, from 2000 to 2022. The horizontal axis represents time in years between 2000 and 2022, the vertical axis is the relative ability of Scotland's natural environment to provide benefits to people.
Woodland
- Although woodland natural capital values are increasing, this is largely driven by an increase in habitat area rather than an improvement in habitat quality. Overall woodland condition is poor. Habitat extent, woodland birds, and certified woodland are driving the increase in woodland natural capital values, overshadowing the overall poor site condition of Scottish woodlands.
- Woodlands have been stable over the short-term (+1.3 percentage points from 2019) and is currently +12.3 percentage points from 2000.
- Woodlands are exceptionally important for providing regulating and maintaining ecosystem services including climate regulation and air pollution – services with a high demand from society in Scotland and a key driver in the NCAI.
- More than half the amount of protected woodland in Scotland is in unfavourable condition at 50.7% (248 of 489 sites measured), while only 34% (167 of 489 sites measured) of woodland on protected areas can be considered to be in favourable condition and 14% (70 of 489 sites measured) are recovering; four sites were not assessed (NatureScot). Condition of woodland has been declining for the duration of the NCAI.
- 60% of woodland in Scotland is certified forest. This means more than half of woodland are under sustainable forest management (Forest Research), a trend that has been consistently increasing since the NCAI was first calculated.
- The net annual change in carbon in woodlands was 7.2 million tonnes of CO2 in 2022 (Forest Research). This indicator has declined since its peak in 2009 due to an uneven woodland age distribution, which has led to a decline in young tree growth with high carbon sequestration potential.
- The woodland bird indicator has improved by 19.6 percentage points since 2000 but declined by 4.3 percentage points since peaking in 2016; chiffchaff, great spotted woodpecker, and blackcap have seen the largest increases (NatureScot).
- The extent of broadleaved deciduous woodland in Scotland increased 60% since 2000 and increased 0.7% for coniferous woodland since 2000 (Forest Research).
- Visitor numbers spiked in 2020 at 79% visiting the outdoors at least once a week. While visitor counts have decreased slightly since 2020, they remain well above pre-2020 levels (2022 visitor count has improved 25% since 2019 and 59% since 2000), indicating that more people in Scotland are spending time in nature. This indicator is applicable to all habitat types.
- Additional factors in this habitat are butterflies, visual influence of built development (inverse), total number of different bird species counted, and agri-environment area.
Inland surface waters
- The Index for inland surface water peaked in 2017. Between 2019 and 2022, inland surface water were stable (-0.2 percentage points) and is currently 8.3 percentage points above the 2000 baseline.
- Site condition has plateaued around 70% favourable since 2018, though this follows an overall downward trend since 2000. In 2022, favourable percentage is 70% (194 out of 279 features). This is 6.4 percentage points lower than the most recent peak in 2012 and 12 percentage points lower than 2000 (NatureScot).
- The Salmon Fishery Statistics 2022 report that wild salmon and grilse rod and line catches from recreational angling in rivers in 2022 is the fourth lowest since 1952. Catches have been trending downwards since 2011 and are now 36.8 percentage points below year 2000 baseline levels. Catch and release is included in the catch statistics meaning the same fish could be caught twice.
- Raw water abstraction has had an increasing trend since 2003, indicating less water is being abstracted and a positive NCAI trend for freshwater habitats (Scottish Water).
- Additional datasets include Water Framework Directive (good or better ecological status), outdoor visits per week, total number of different bird species counted, river water quality (percentage of unpolluted sites), raw water quality (nitrates in rivers), pollution (orthophosphates).
Coastal
- Coastal habitats have been stable since 2019 (-0.9 percentage points) and is currently 5.2 percentage points higher than 2000).
- Coastal site condition has decreased slightly compared with 2021 results with 248 of 335 sites in favourable condition, which continues a downward trend that has been recorded since 2017 (NatureScot).
- Coastal habitats captured in the NCAI, by EUNIS category, are coastal dunes and sandy shores (B1), coastal shingle (B2), and rock cliffs, ledges and shores (B3).
- Wintering waterbirds have seen a decline since 2017 (down 7.4 percentage points in 2022 from 2017) (NatureScot).
- Coastal bathing water quality is a heavily weighted indicator for coastal habitats but has not been updated since 2014 due to the change in scale of how bathing water quality is measured.
- Additional factors in this habitat are visual influence of built development (inverse), outdoor visits per week, total number of different bird species counted, butterflies, upland birds, use of marked coastal paths.
Grasslands
- Grasslands have been stable since 2019 (-1.2 percentage points) and since 2000 (+1.96 percentage points).
- The condition of protected grassland sites had the biggest impact on the grassland trend which has decreased by 8.0 percentage points since 2019 (NatureScot), but is balanced out by the other quality indicators.
- No agricultural census took place in 2022 due to improvement work around the census. However, 2022 results were estimated using data from the 2020 and 2023 census. Cattle numbers saw a continuation of a long-term declining trend since 1974, largely attributed the declining profitability of cattle (Scottish Agricultural Census June 2022). Sheep numbers shows a slight decrease from 2021, though the overall trend remains constant (Scottish Agricultural Census June 2022).
- Agri-environment areas are where the environmental management strives to conserve wildlife, enhance the landscape, protect the natural and historic environmental resources and promote public access. Areas with agri-environment schemes in place reached a peak in 2020 and has since decreased due to a closure of schemes categorised as entry-level for new applicants (JNCC), though this indicator still remains 14.2 percentage points above 2019 and 30 percentage points above the 2000 baseline.
- Farmland birds are an indicator for grassland regulating and maintaining and cultural ecosystem services. They have been declining since 2008 and have now fallen below year 2000 levels (NatureScot).
- Additional factors in this habitat are visual influence of built development (inverse), outdoor visits per week, total number of different bird species counted, area of grass cut for hay, butterflies, and upland birds.
Heathland
- Heathlands are stable (-0.4 percentage points from 2019) after a low in 2011 but are still below year 2000 levels
- The condition of protected heathlands has remained stable since 2017 with 39 of 115 sites (34%) in favourable condition and 19 of 114 sites (17%) in recovering condition (NatureScot).
- The upland bird indicator has decreased by 19.8 percentage points since 2000 (NatureScot); upland birds are important for regulating and maintaining and cultural ecosystem services for heathland.
- Adult red grouse density was not updated for 2022 in time to be included in the 2025 NCAI update. However, in 2021, adult red grouse was recorded at 59 birds per hectare, an 18% increase from 2020 but a 30% decrease from its peak of 84 birds per hectare in 2015. Post-breeding densities are lower in Scotland than in northern England (Game and Wildlife Conservation Trust Review of 2021).
- Additional factors in this habitat are visual influence of built development (inverse), outdoor visits per week, total number of different bird species counted, and butterflies.
Mires, bogs, fens
- Mires, bogs, fens remain stable (-0.3 percentage points from 2019) but remain below year 2000 levels (-3.8 percentage points).
- The condition of protected mires, bogs and fens sites have decreased from 2000 with 52% of sites in favourable condition in 2022 (182 out of 348 features) (NatureScot).
- The upland bird indicator has decreased 19.8 percentage points since 2000 (NatureScot); upland birds are important for regulating and maintaining and cultural ecosystem services for heathland.
- Additional factors in this habitat are visual influence of built development (inverse), outdoor visits per week, and total number of different bird species counted.
Agriculture and cultivated
- Agriculture and cultivated habitats increased 4.6 percentage points from 2019. The main causes for this increase are a decreased fertiliser use and increased habitat extent since 2018.
- Prior to the latest increasing trend, agriculture and cultivated land has consistently been the habitat group with the smallest potential for ecosystem services, staying below its 2000 baseline since 2002. This habitat remains 2.2 percentage points below the year 2000 baseline.
- Cereal yield has increased 4.9 percentage points since 2019, with a total yield of 7.6 tonnes per hectare in 2022. This is the highest yield on record in the past 20 years, attributed to long periods of hot and dry conditions (Cereal and Oilseed Rape Harvest 2022).
- Weight of fertiliser use decreased by 16.9 percentage points from 2019 (British survey of fertiliser practice 2022), which increases the natural capital of arable land and improves the habitat score. Note, this indicator does not account for the amount of an active ingredient.
- Pesticide use (used as an inverse indicator) has shown a decreasing trend since its peak in 2014. However, this still remains above its year 2000 NCAI baseline. Active substance area of all pesticides for total arable crops includes cereals, oilseed rape, potatoes, and legumes (Arable crops and Potato stores 2022).
- Farmland birds are an indicator for agriculture and cultivated regulating and maintaining and cultural ecosystem services. They have been declining since 2008 and are currently below year 2000 levels (NatureScot).
- Additional factors in this habitat are visual influence of built development (inverse), outdoor visits per week, total number of different bird species counted, butterflies, agri-environment area, and bare fallow/set-aside area.
Policy relevance
Natural capital provides benefits that support a wide range of government objectives and policy areas, ranging from agriculture (through supporting a healthy soil system) to community safety (through protecting against floods and other extreme weather events). Strategic maintenance and enhancement of natural capital can help to alleviate pressures on a wide variety of policy areas, creating benefits that support both people and ecosystems within Scotland.
In order to take a targeted approach to enhancing natural capital to support various Scottish policy areas and objectives, NatureScot will be developing policy area specific NCAI results. An initial desk-based scoping exercise identified many policy areas that are underpinned or enhanced by ecosystem services. We will be working with stakeholders to develop this work further.
Notes on data
- 11 out of the 38 indicators were not updated in 2025. Therefore, the accuracy of the Index is limited. A refresh is scheduled in 2025 that will address these outdated indicators.
- Data for the NCAI comes from the following sources: NatureScot; Scottish Agricultural Statistics; Forest Research; Scottish Environment Protection Agency; Scottish Water; Salmon Fishery Statistics; Game & Wildlife Conservation Trust; Greenspace Scotland; Cereal and Oilseed Rape Harvest; Scottish Agricultural Census; British Survey of Fertiliser Practice; Pesticide Usage in Scotland; JNCC; December Agriculture Survey; Breeding Bird Survey; Scottish Household Survey
Historic trends of the Natural Capital Asset Index
A back casting exercise was attempted to backdate the Index to 1950 to understand the longer-term trends of natural capital in Scotland. Unfortunately, this exercise could not use the same detail of habitat quality data that has been available since around the year 2000. However, using more coarse datasets we were able to demonstrate the longer-term trends of natural capital in Scotland.
The trend suggests that natural capital was in decline from 1950 to 1990 and efforts to recover natural capital in Scotland still have some way to go to return to historic levels.
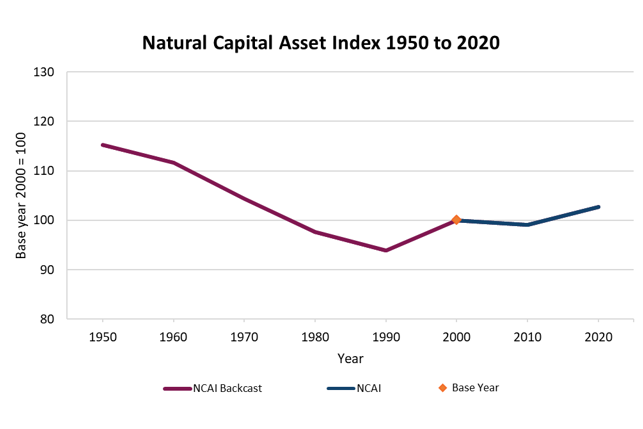
Figure 6: Historic trends of the NCAI
Click for a full description
A graph of the NCAI with the horizontal axis as time from 1950 to 2020 and the vertical axis is the relative ability of Scotland's natural environment to provide benefits to people. Back cast data are used from 1950 to 2000 and the current NCAI methodology is used from 2000 to 2020.
A refresh of the Natural Capital Asset Index
NatureScot conducted the first of a two-part refresh of the NCAI in autumn 2022. The focus of the first half of this refresh was on improving the transparency and communication of the Index. The second half of this refresh of the Index will take place in 2025, focusing on gaps in the suite of quality indicators for habitat characteristics.
The Index will become a biennial indicator, with the next publication in 2026. This 2026 publication will incorporate outcomes from both the first and second refresh and include any updates to its data inputs.
Scotland’s National Natural Capital Accounts
The Scottish Natural Capital Accounts (the Accounts) are experimental statistics produced in partnership with the UK Office for National Statistics and the Rural & Environmental Science and Analytical Services team in Scottish Government. The Accounts look at what the natural capital assets in Scotland are, the physical and monetary flows of these assets and the values of the ecosystem services they provide.
The 2024 release of the Scottish Natural Capital Accounts found Scotland’s natural asset value to be £254.7 billion in 2022. The total value of annual flows from Scottish natural capital assets in 2022 was £38.7 billion. A summary of the report can be found here.
The Accounts are not a price tag for nature in Scotland but a tool to help understand nature’s impact on people and to help incorporate nature into policymaking decisions. The asset values are not an absolute "value" of the price we would accept to sell the entire natural world. The natural world supports all life on earth, and its collapse would precipitate our own, implying infinite value.
The Accounts differ from the NCAI in many ways but are complementary models to understand natural capital in Scotland. More detail on the NCAI and the Accounts can be found on our NCAI + NCA Comparison webpage.
Final notes and contact details
Visit our NCAI StoryMap for a visual experience of Scotland’s natural capital.
An overview on the technical background with frequently asked questions about the Index
Further technical information on the NCAI and how it was formed can be found in the journal Ecological Indicators (McKenna et al, 2019).
Please get in touch if you would like further information by emailing Aidan Price, aidan.price@nature.scot