Scotland's Indicators - Landscape
Published: 2022
Please note you can download a 'pdf' version of the 2022 indicators at the foot of this page. Parts of these documents may not be accessible to screen reader software and may use colour to convey information.
Natural heritage and landscape area indicators from 2010-2022
Natural Heritage Indicators
Natural Heritage Indicators - N2 & N3
Viewing these indicators below will take you to archived versions.
Landscape Indicators
Landscape Qualities - LLQ1 & LLQ2
Viewing these indicators below will take you to archived versions.
LLQ1 Area of National Landscape Designations
LLQ2 Perceived Naturalness of Land Cover in Central Scotland Green Network (CSGN)
Landscape Qualities - LLQ3
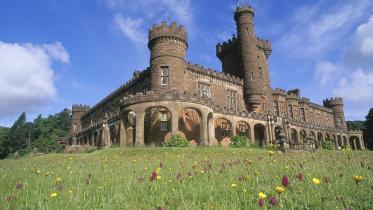
Local Landscape Areas (LLAs) are designated to safeguard and enhance the character and quality of a landscape which is valued locally or regionally. They can be used to promote understanding and awareness of the distinctive character and special qualities of local landscapes, or to safeguard and promote important local settings for outdoor recreation and tourism. This indicator assesses the extent of land covered by local landscape designations. In the past a range of different names have been used for a local landscape designation: these are all now referred to as Local Landscape Areas (LLAs).
Photograph of Duddingston Loch, Edinburgh, Special Landscape Area. Copyright Glyn Satterley
The purpose of LLAs is set out in Scottish Planning Policy. It is the responsibility of local authorities to designate them where they are used; most but not all Local Authorities have LLAs. The European Landscape Convention promotes the protection, management and planning of all landscapes, regardless of character or condition. Local landscape designations remain relevant as part of this approach. They complement the suite of national landscape designations, such as National Scenic Areas (NSAs) and National Parks (NPs), and act as an important tool for safeguarding and enhancing Scotland’s rich diversity of landscapes. LLAs occur across Scotland and Local Development Plans show detailed information on their location and associated policy.
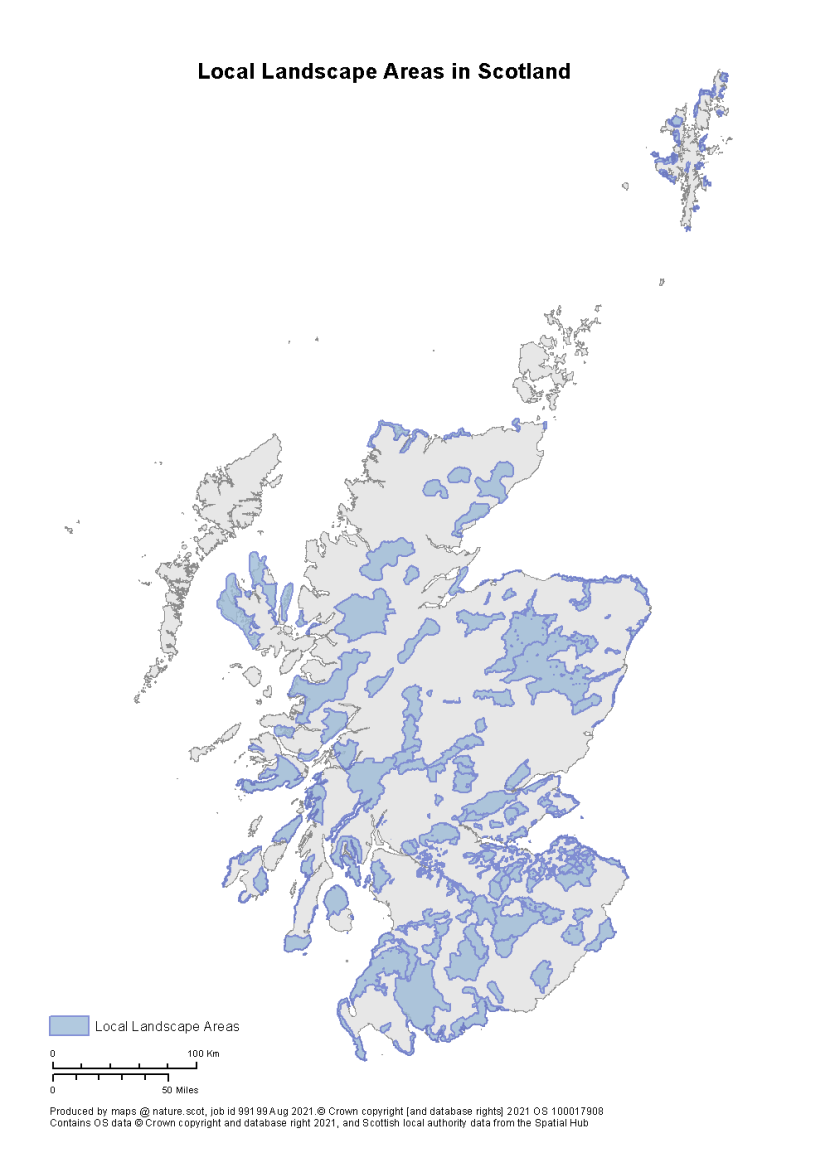
Map showing locations of Local Landscape Areas in Scotland in 2017.
Evidence
Spatial data on LLAs were sourced through the Scottish Local Government Spatial Hub. In 2017, Spatial Hub completed the first assessment of all LLAs in Scotland, setting a baseline for this indicator.
TREND: Baseline
DATA CONFIDENCE: High
Assessment
In 2017, the total area for LLAs in Scotland is 2,210,832ha. There were 502 LLAs that covered 27% (2,109,707.5ha) of the land area of Scotland to MHWS (calculated by vector analysis as 7,880,328ha), with a further 101,124.5ha extending below MHWS to include intertidal and sea areas.
Out of 32 local authorities, eight local authorities did not use LLAs in 2017. They were: Aberdeen City, Angus, Dundee City, East Renfrewshire, Inverclyde, Orkney, Renfrewshire and the Western Isles.
As this indicator sets a baseline there can be no comparisons made for assessment.
Commentary
Amongst local authorities the proportion of their areas covered by LLAs varies considerably. South Ayrshire and Midlothian councils have the greatest proportion 58.9% (two LLAs) and 58.7% (seven LLAs) respectively. North Lanarkshire with 1.7% cover (one LLA) and East Dunbartonshire with 8.6% cover (30 LLAs) have the least amount of cover. The size of LLAs also varies across local authorities, with Aberdeenshire having the largest at 178,897.37ha and Glasgow the smallest at 0.003ha. Glasgow has the most LLAs with 214 and North Lanarkshire and West Dunbartonshire both have the fewest with one LLA each.
| Local Authority | Area of LLAs (ha) | Number of LLAs | LLAs as % of Local Authority Area | Largest LLA (ha) | Smallest LLA (ha) | Trend in LLA area from 2017 baseline |
|---|---|---|---|---|---|---|
| Aberdeenshire | 240,081.26 | 7 | 37.88 | 178,897.37 | 1,306.87 | n/a |
| Argyll and Bute | 269,141.43 | 16 | 37.57 | 90,787.86 | 58.37 | n/a |
| City of Edinburgh | 9,120.81 | 22 | 33.41 | 4,463.35 | 11.71 | n/a |
| Clackmannanshire | 7,260.50 | 2 | 44.29 | 6,130.22 | 1,130.28 | n/a |
| Dumfries and Galloway | 256,563.07 | 10 | 38.43 | 103,846.59 | 2,706.34 | n/a |
| East Ayrshire | 47,506.55 | 2 | 37.40 | 32,332.08 | 15,174.47 | n/a |
| East Dunbartonshire | 1,493.98 | 30 | 8.56 | 228.87 | 2.46 | n/a |
| East Lothian | 31,916.42 | 32 | 45.53 | 4,169.02 | 15.27 | n/a |
| Falkirk | 6,519.88 | 4 | 20.70 | 1,978.57 | 975.10 | n/a |
| Fife | 37,441.31 | 22 | 27.25 | 7,260.14 | 0.20 | n/a |
| Glasgow City | 3,679.08 | 214 | 20.85 | 610.19 | 0.01 | n/a |
| Highland | 599,074.89 | 28 | 22.63 | 92,332.44 | 867.92 | n/a |
| Midlothian | 20,855.46 | 7 | 58.70 | 6,791.91 | 834.00 | n/a |
| Moray | 92,086.92 | 8 | 40.80 | 3,659.20 | 78.43 | n/a |
| North Ayrshire | 42,333.97 | 7 | 46.83 | 24,291.54 | 8.60 | n/a |
| North Lanarkshire | 801.52 | 1 | 1.70 | 801.52 | 801.52 | n/a |
| Perth and Kinross | 145,757.48 | 11 | 26.90 | 34,195.64 | 5,015.12 | n/a |
| Scottish Borders | 153,114.08 | 9 | 32.28 | 53,569.09 | 4,469.30 | n/a |
| Shetland Islands | 28,872.99 | 17 | 17.43 | 4,243.00 | 271.65 | n/a |
| South Ayrshire | 72,731.00 | 2 | 58.91 | 70,183.64 | 2,547.37 | n/a |
| South Lanarkshire | 68,507.62 | 6 | 38.62 | 23,579.87 | 1,314.25 | n/a |
| Stirling | 54,200.62 | 8 | 24.04 | 24,856.76 | 265.91 | n/a |
| West Dunbartonshire | 6,439.50 | 1 | 35.23 | 6,439.50 | 6,439.50 | n/a |
| West Lothian | 15,831.54 | 36 | 36.68 | 7,285.73 | 0.58 | n/a |
LLAs can complement national landscape designations, such as the 40 NSAs and 2 NPs. LLAs are unnecessary within an NSA or NP, given the measures already in place to protect and manage these landscapes, although overlaps do exist. Some local authorities support NSAs and NPs by designating LLAs adjacent to them and contributing to their objectives e.g. seven LLAs adjoin the Loch Lomond and the Trossachs NP and eight adjoin the Cairngorm NP.
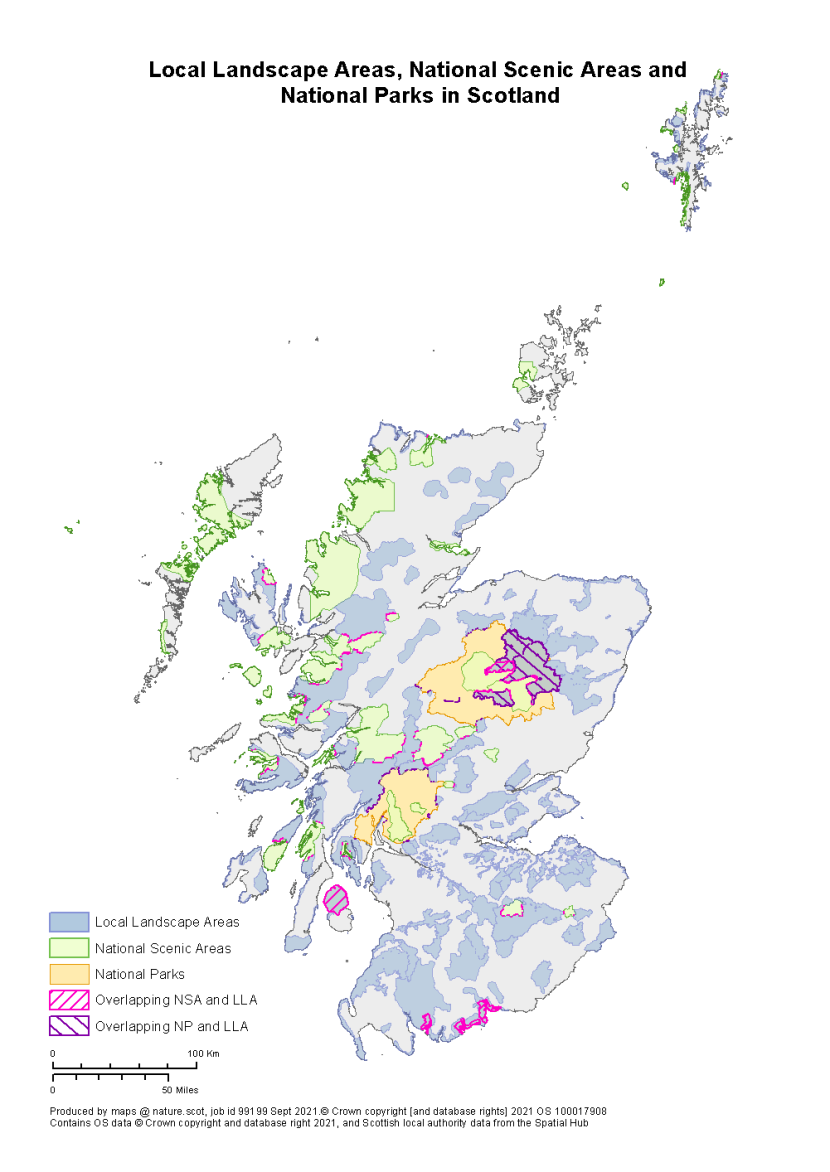
Map of Local Landscape Designations in 2017 with National Parks and National Scenic Areas.
Gardens & Designed Landscapes, Battlefields and Scheduled Monuments are national cultural designations that can contribute to the quality and value of LLAs. For example, a disproportionate area of Gardens & Designed Landscapes overlaps with LLAs (43%) compared to the 27% of land covered by LLAs overall. Natural designations, such as national Sites of Special Scientific Interest (SSSIs) and Geological Conservation Review sites (GCRs), can also contribute to quality and value of LLAs.
There are a number of other aspects that can be considered. For example, the percentage of the coastline of Scotland that is covered by LLAs is 4,982.1km, which is 26% of the entire coastline and 39% of the coastline of the non-landlocked local authorities who designated LLAs. This indicates the relative value we place on the coast. For the local authorities that designate LLAs, the percentage of their urban areas covered by LLAs is 5% and the percentage of rural areas covered by LLAs is 30% (urban and rural areas are defined by the Scottish Government’s urban / rural classification). This shows that rural areas contribute more to LLAs than urban areas. A simple visual comparison of the spatial relationship of LLAs with our national coverage of Landscape Character Types (LCTs) reveals overall that most LLAs overlap multiple LCTs rather than follow their boundaries. This makes sense as the overlaps mean the LLAs have greater landscape variety within them. Nonetheless, some LLAs do appear to have more affinity with certain LCTs in lowland areas, such as river valleys, uplands and hills that contrast with the overall lowland landscape. This again suggests that LLAs are valued for their diversity and distinctiveness.
Source data and updates
Spatial data on Local Landscape Areas were sourced from Spatial Hub. The Indicator will be updated next in 2023.
UK indicators
There is no directly comparable UK indicator. In England and Northern Ireland, county councils tend to use Landscape Character Assessments to manage local landscape change. In England these are informed by Natural England’s National Character Area Profiles. In Wales, LANDMAP is used by Natural Resources Wales to set a baseline and support the management of both national and local landscapes.
Public Perception - LPP1 & LPP2
Viewing these indicators below will take you to archived versions.
Land Cover - LLC1
Viewing these indicators below will take you to archived versions.
Land Cover - LLC2
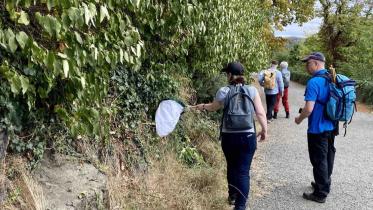
This Indicator assesses the extent of greenspace in urban areas across Scotland.
Urban greenspace, such as public parks, canals and rivers, and sports areas, make a significant contribution to urban biodiversity and landscapes, climate change mitigation and adaptation, our quality of life and quality of place. They contribute to improving physical and mental health and wellbeing, as well as helping to attract investment and creating places where people want to live and work. Greenspaces help communities connect and engage with nature which has been shown to have a positive impact on pro-environmental and pro-conservation behaviours. The planning and management of greenspace also provides opportunities for communities to engage in local decision making and action, helping to build community cohesion, resilience and empowerment. This indicator monitors the extent of urban green and blue spaces (such as ponds, rivers and canals) as a percentage of urban land area. Understanding changes in the extent, distribution and types of greenspace is essential for the strategic planning and management of Scotland’s greenspace assets to enable them to deliver better quality local landscapes.
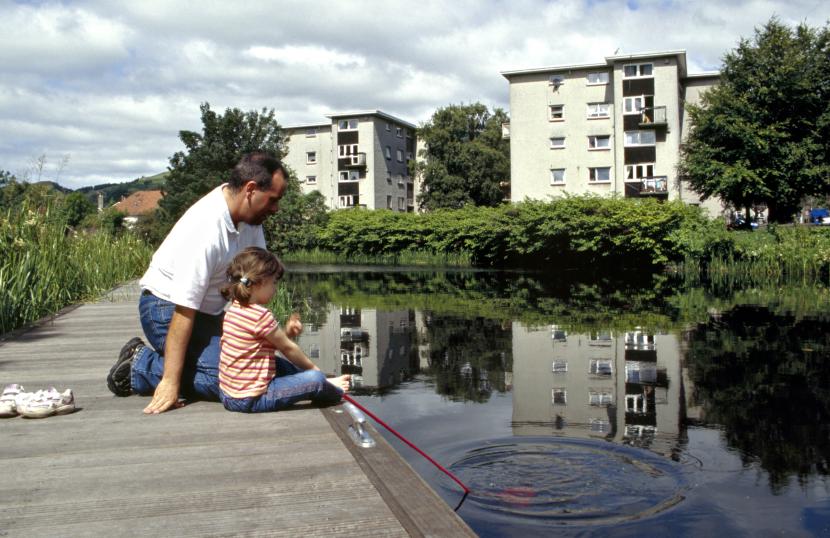
Father and daughter pond dipping at the Forth & Clyde Canal, Kilpatrick, Copyright George Logan
Evidence
This Indicator uses data from the Ordnance Survey Greenspace MasterMap, the Third State of Scotland’s Greenspace Report and the 2017 Greenspace Use and Attitudes Survey to assess the extent of greenspace in urban areas across Scotland. Urban land area is defined by the Scottish Government’s two-fold urban - rural classification as settlements with 3000 or more people.
Assessment
In 2017 the total extent of all urban greenspace in Scotland was 159,274ha covering 54% of urban land area.
TREND: Baseline
DATA CONFIDENCE: High
Commentary
The proportion of greenspace in urban land as of 2017 was 54% making urban Scotland more green than grey. The Third State of Scotland’s Greenspace Report shows that seven local authorities had greenspace cover less than 50% of their urban land area. Greenspace as a percentage of urban area amongst mainland local authorities ranges from 42% in Aberdeenshire and East Ayrshire, to 67% in Argyll and Bute.
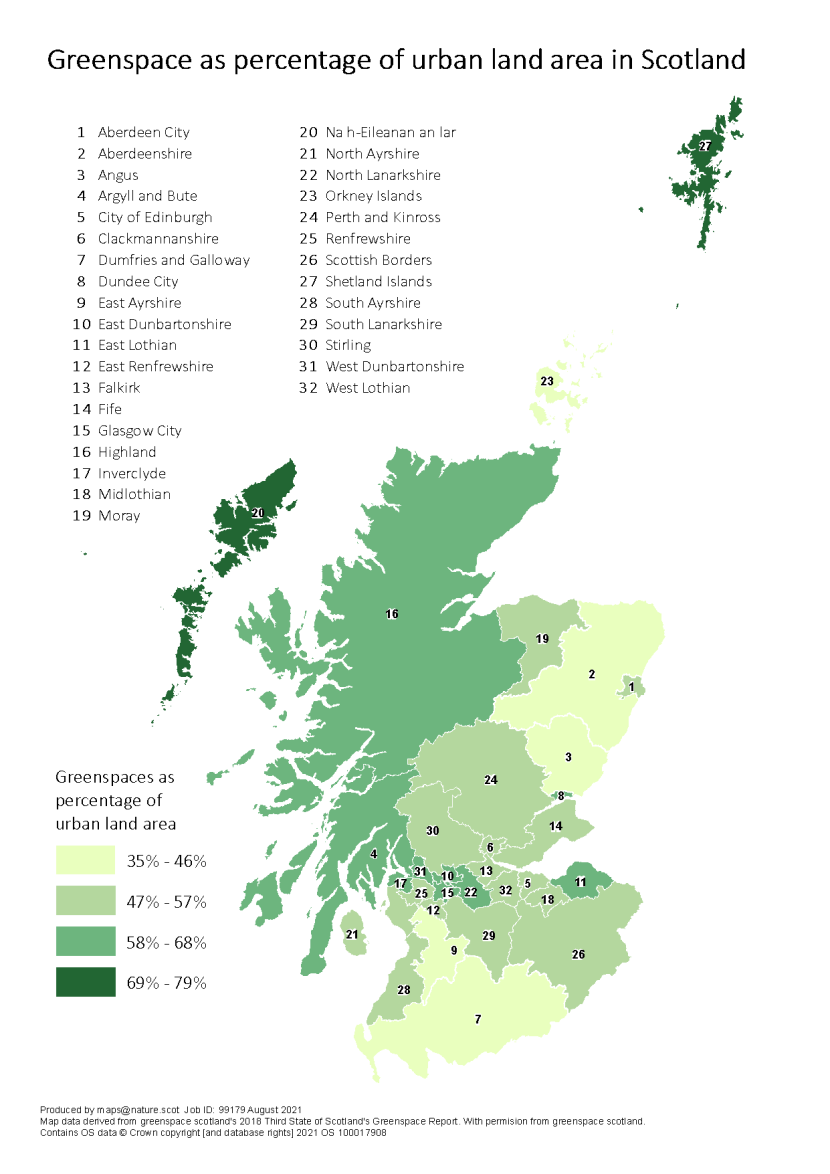
Greenspace as a percentage of urban land area by local authority.
Click for a full description
Map of Scotland with local authority boundaries marked. Each local authority is colour coded depending on the percentage range of greenspaces they have as a percentage of their urban land area. Percentage ranges are 35 to 46, 47 to 57, 58 to 68 and 69 to 79 percent.
| Local Authority | Total Area of greenspace (ha) | Area of publicly accessible greenspace (ha) | Greenspace as percentage of urban area (%) | Publicly accessible greenspace as percentage of urban area (%) | Area of greenspace per 1000 people (ha) | Area of publicly accessible greenspace per 1000 people (ha) |
|---|---|---|---|---|---|---|
| Aberdeen City | 6,338 | 4,600 | 54 | 39 | 29 | 21 |
| Aberdeenshire | 5,858 | 4,239 | 42 | 31 | 47 | 34 |
| Angus | 3,536 | 2,603 | 46 | 34 | 42 | 31 |
| Argyll and Bute | 3,768 | 3,050 | 67 | 54 | 88 | 71 |
| City of Edinburgh | 8,997 | 6,041 | 55 | 37 | 19 | 13 |
| Clackmannanshire | 2,124 | 1,679 | 49 | 39 | 48 | 38 |
| Dumfries and Galloway | 4,323 | 3,180 | 43 | 32 | 53 | 39 |
| Dundee City | 3,478 | 2,320 | 62 | 41 | 24 | 16 |
| East Ayrshire | 3,171 | 2,230 | 42 | 29 | 37 | 26 |
| East Dunbartonshire | 3,880 | 2,628 | 59 | 40 | 39 | 26 |
| East Lothian | 3,242 | 2,602 | 58 | 46 | 43 | 35 |
| East Renfrewshire | 2,569 | 1,538 | 53 | 32 | 29 | 18 |
| Falkirk | 6,463 | 5,035 | 57 | 44 | 45 | 35 |
| Fife | 12,101 | 9,081 | 50 | 37 | 41 | 30 |
| Glasgow City | 9,647 | 6,709 | 58 | 40 | 16 | 11 |
| Highland | 9,032 | 7,430 | 58 | 47 | 77 | 63 |
| Inverclyde | 3,126 | 2,439 | 60 | 46 | 40 | 31 |
| Midlothian | 2,946 | 2,223 | 52 | 39 | 42 | 31 |
| Moray | 2,572 | 1,932 | 51 | 38 | 48 | 36 |
| Na h-Eileanan an Iar | 1,691 | 1,496 | 79 | 70 | 227 | 201 |
| North Ayrshire | 5,699 | 4,443 | 55 | 43 | 46 | 36 |
| North Lanarkshire | 12,995 | 10,248 | 64 | 50 | 42 | 33 |
| Orkney Islands | 342 | 213 | 35 | 22 | 48 | 30 |
| Perth and Kinross | 4,009 | 2,903 | 48 | 35 | 50 | 36 |
| Renfrewshire | 5,886 | 4,416 | 55 | 41 | 35 | 27 |
| Scottish Borders | 3,900 | 3,189 | 53 | 43 | 65 | 53 |
| Shetland Islands | 880 | 795 | 71 | 64 | 125 | 113 |
| South Ayrshire | 3,552 | 2,473 | 55 | 38 | 40 | 28 |
| South Lanarkshire | 9,421 | 6,733 | 53 | 38 | 34 | 24 |
| Stirling | 3,205 | 2,479 | 52 | 40 | 53 | 41 |
| West Dunbartonshire | 3,343 | 2,654 | 61 | 48 | 37 | 30 |
| West Lothian | 7,178 | 5,697 | 54 | 43 | 45 | 36 |
| Urban Scotland | 159,274 | 119,299 | 54 | 41 | 36 | 27 |
Greenspace Types
The OS Greenspace MasterMap uses greenspace types defined by their primary function, such as public parks, playing fields and amenity greenspace. Whilst many greenspaces have more than one function, the figures presented here refer to primary functions only. In 2017, 28% of greenspace was classified as private gardens and grounds, with all amenity greenspace types making up a further 37% – together these two types account for two-thirds of Scotland’s greenspace, making a significant contribution to urban landscapes. Natural greenspace accounts for nearly one-fifth (19%) of urban greenspace: this is made up of open semi-natural (8%), woodland (5%), beach or foreshore (4%) and inland water (2%). Public parks and sports areas, which are the public spaces most often used in daily life, account for 4% and 9% of greenspace respectively. Play spaces, allotments and community growing spaces, cemeteries and religious grounds cover relatively small areas (3% in total).
Publicly Accessible Greenspace
The total area of ‘publicly accessible’ greenspace (i.e. excluding private gardens and grounds, such as schools and businesses) is 119,299ha or 27ha per 1000 people, which is equivalent to a tennis court size of greenspace per person. The historic settlement and development pattern of cities, towns and neighbourhoods can have a significant impact on the amount, distribution and type of greenspace. The area of publicly accessible greenspace per 1000 people ranges in mainland local authorities from 11ha in Glasgow to 71ha in Argyll & Bute. Publicly accessible greenspace as a percentage of urban area in mainland local authorities ranges from 29% in East Ayrshire to 50% in North Lanarkshire and 54% in Argyll & Bute.
Accessible Greenspace
Greenspace matters to people: in 2017 the Scottish Household Survey (SHS) showed that 92% of people agree to some extent that it is important to have greenspace in their local area, with nearly half (43%) of urban residents visiting their local greenspace at least once a week and over 162 million visits to parks and greenspaces made each year. The SHS in 2017 showed that 65% of adults lived within a 5 minute walk of their nearest greenspace (excluding private gardens), which is an indicator used for Scotland’s National Performance Framework. People living in the most deprived areas are less likely to live within a 5 minute walk of their nearest greenspace than people in less deprived areas.
Greenspace Quality
While quantitative data on greenspace are a valuable resource, the full benefits of greenspace can be shown by its quality and how it is experienced, used and valued by people. Key findings from the 2017 Greenspace Use and Attitude Survey shows that the downward trend in the quality of Scotland’s parks and greenspaces has continued. Scottish councils’ spend on parks and greenspace service has reduced by 24% between 2011 and 2016. The Survey found that over 70% of respondents agreed strongly that greenspaces should be good places for play, physical activity and relaxation; 66% agreed strongly that greenspace should provide opportunities to see nature; and 53% thought they should be good places to meet others from the local community. Further reports on the State of Scotland’s Greenspace will provide an update on work by local authorities to audit their greenspace, assess the quality of these spaces and prepare open space strategies and other plans.
Source data and updates
This Indicator will next be updated in 2023. The OS Greenspace MasterMap is updated six monthly. The Scottish Household Survey is carried out annually.
UK indicators
There is no directly comparable UK indicator. Fields in Trust have produced a Green Space Index that monitors a minimum standard for greenspace provision across the nations and regions of the UK. Accessible natural greenspace standards by local authority are monitored in Wales. Northern Ireland have not as yet produced any mapping of publicly accessible parks and greenspaces.
Land Cover - LLC3
This indicator monitors the extent of urban vacant and derelict land (V&DL) as registered by Scottish Local Authorities through the Scottish Vacant and Derelict Land Survey (SVDLS).
Vacant and derelict land is viewed as degraded and appropriate for some form of development and re-use. Many of these sites are potentially hazardous, visually unattractive, and detract from the quality of life of nearby communities. However, some vacant and derelict land can be of value for biodiversity, contain important landscape features or provide opportunities for informal recreation and play. Prior to re-using vacant and derelict land consideration should be given to the nature that has colonised the sites, its landscape features which may be worth retaining and how people might have used these areas whilst they have lain undeveloped. For such sites, there are potential opportunities for long-term regeneration, to improve health and wellbeing, help us tackle climate change, create more resilient communities and enable more sustainable place making. Using nature-based solutions to rehabilitate these sites would also help to optimise the multiple benefits delivered.
Dumbreck Marsh Local Nature Reserve previously a derelict site covered in coke and coal waste. ©George Logan
“Vacant” land is defined as land which is unused for the purposes for which it is held and is viewed as an appropriate site for beneficial use or development. This land must either have had prior development or had preparatory work taken place in anticipation of future re-use. “Derelict” land is defined as land which has been so damaged by development that it is incapable of further use without rehabilitation. The statistics presented on “vacant” land throughout this indicator refer to land located in settlements with a population of over 2,000 (as defined in council local plans) i.e. “urban vacant” land. Statistics on “derelict” land refer to all of Scotland’s land area. In total, around a third of all urban vacant and derelict land across Scotland has not been developed for at least 25 years.
Scotland’s Vacant and Derelict Land Taskforce has produced a report and recommendations aimed at transforming the existing approach to bringing vacant and derelict land back into use. The Taskforce recognised the value of the Vacant and Derelict Land Register and suggested improvements to better enable regeneration. The Register as it stands does not provide a complete or comprehensive picture of the status of vacant and derelict land in Scotland, nor does it include sites under 0.1 hectares. Scottish Land Commission research has shown that many smaller sites tend to negatively impact communities and are often clustered in settlements with higher rates of multiple deprivation.
Evidence
This Indicator uses the SVDLS data directly from the Scottish Government and the Spatial Hub. The SVDLS has been operating since 1988. In 2017 the Scottish Government published a summary of results that included a revision of collected data that presented an accurate time series analysis from 2011 to 2017. This report provides the data for our assessment below. Therefore, this Indicator sets a baseline at 2017 when the Scottish Government published this analysis.
TREND: Baseline
DATA CONFIDENCE: High
Assessment
In 2017, the total area of urban vacant and derelict land in Scotland was 11,649 hectares.
The area of urban vacant and derelict land showed a net increase of 2% between 2011 and 2017. This increase was largely due to an additional 2,217 hectares of land being included in 2014 after areas of former surface coal mine sites in East Ayrshire became derelict.
From 2016 to 2017 the amount of urban vacant and derelict land decreased by 844 hectares (7%). This resulted from 780 hectares being re-used or changed and 293 hectares naturalised (meaning sites dominated by colonised vegetation), minus 229 hectares of newly identified urban vacant and derelict land. The graph below (from the SVDLS 2017 report) shows the amount of urban vacant and derelict land from the years 2011 to 2017.
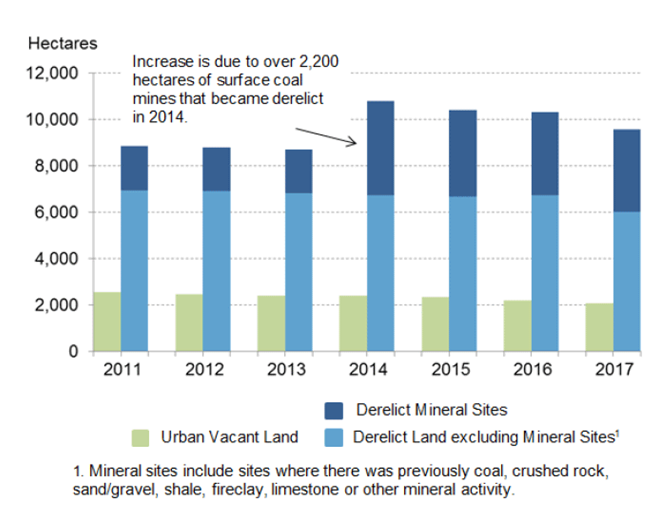
Chart showing Total Urban Vacant and Derelict Land from 2011 to 2017.
Click for a full description
The chart shows a slight increase (2%) in the area of urban vacant and derelict land between 2011 and 2017. This increase was largely due to areas of former surface coal mine sites in East Ayrshire becoming derelict in 2014. From 2016 to 2017 the amount of urban vacant and derelict land decreased overall.
Bar chart shows seven years (2011 to 2017) along the x axis and number of hectares along the y axis. The bars are divided showing different hectares for urban vacant land, derelict mineral sites and derelict land excluding mineral sites. Mineral sites include sites where there was previously coal, crushed rock, sand/gravel, shale, fireclay, limestone or other mineral activity.
Commentary
Across Scotland, 35% of urban vacant and derelict land can be thought of as being uneconomic to develop and/or is viewed as suitable to reclaim for a ‘soft’ end use (i.e. non-built use). The most common new use for sites that were previously urban vacant and derelict land was for residential development, with 50% of sites reclaimed for this purpose.
Reclamation should consider how best to retain or enhance the existing biodiversity and landscape features on site, as these can be of value and help create better outcomes for people and nature. The UK Biodiversity Action Plan lists Open Mosaic Habitat on previously developed land as a priority habitat. A NatureScot commissioned report noted that strategically it would be good to retain some habitat which is important for invertebrates (and other species), such as Open Mosaic Habitat.
On average, 339 hectares of urban vacant and derelict land per year was reclaimed between 2011 and 2016. In 2017 there was a notable increase in reclamation with 857 hectares of urban vacant and derelict land reclaimed on 317 sites. The Scottish Land Commission provides examples of transformed vacant and derelict land that includes places to connect with nature, to play and to help tackle climate change e.g. through natural flood management. The Green Infrastructure Strategic Intervention fund projects provide additional examples of sites brought back into multi-functional use, including for biodiversity and climate change, with community participation, place-making, health and well-being benefits.
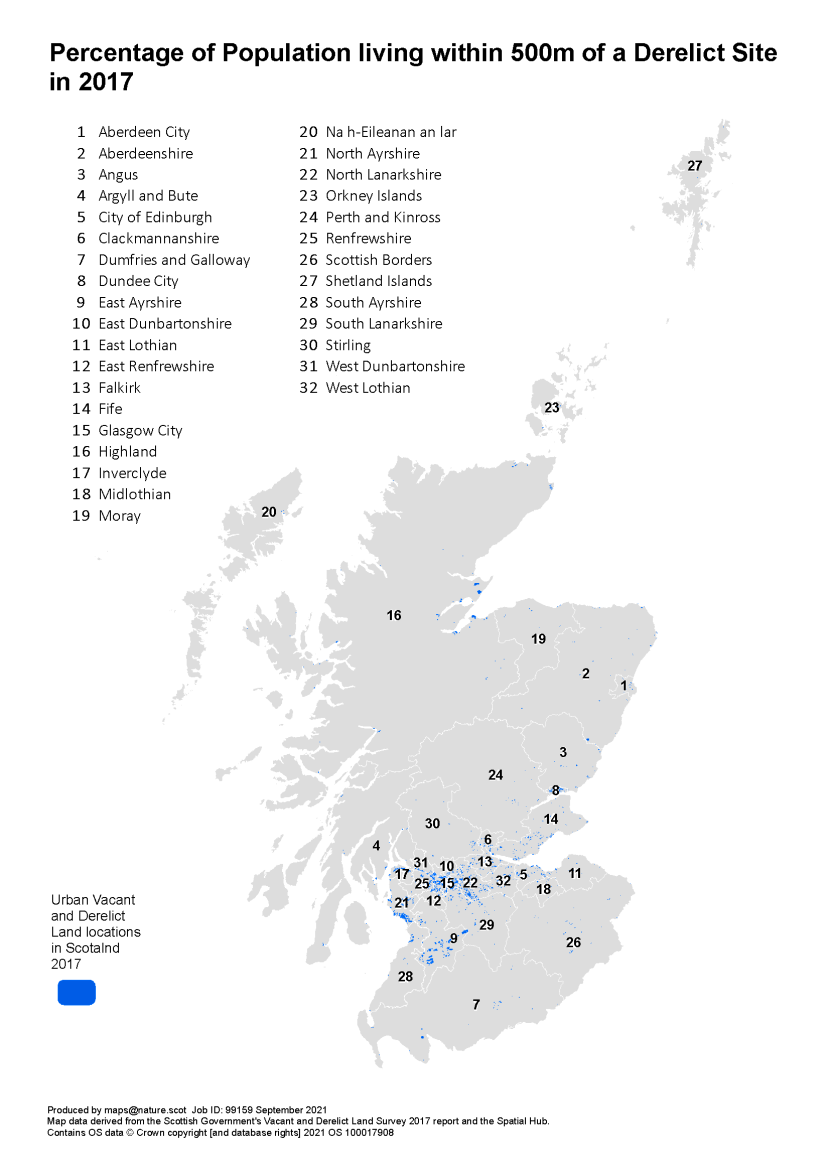
Urban Vacant and Derelict Land locations in Scotland in 2017
Click for a full description
Map of Scotland showing urban vacant and derelict land locations in Scotland in 2017. The map shows local authority boundaries. The map shows that most urban and vacant derelict land locations are within the central belt of Scotland.
| Local Authority | 2011 | 2012 | 2013 | 2014 | 2015 | 2016 | 2017 | % change |
|---|---|---|---|---|---|---|---|---|
| Aberdeen City | 50 | 54 | 52 | 46 | 37 | 38 | 35 | -30% |
| Aberdeenshire | 81 | 83 | 75 | 71 | 71 | 79 | 80 | -2% |
| Angus | 170 | 173 | 173 | 183 | 164 | 142 | 144 | -15% |
| Argyll & Bute | 29 | 34 | 34 | 31 | 59 | 58 | 58 | 100% |
| Clackmannanshire | 29 | 21 | 28 | 36 | 32 | 74 | 64 | 119% |
| Dumfries & Galloway | 491 | 492 | 492 | 491 | 463 | 465 | 320 | -35% |
| Dundee City | 198 | 187 | 196 | 211 | 215 | 204 | 182 | -8% |
| East Ayrshire | 335 | 335 | 351 | 2,553 | 2,541 | 2,457 | 2,401 | 617% |
| East Dunbartonshire | 65 | 71 | 66 | 62 | 71 | 77 | 76 | 17% |
| East Lothian | 83 | 65 | 67 | 65 | 86 | 90 | 87 | 5% |
| East Renfrewshire | 54 | 55 | 60 | 60 | 55 | 55 | 51 | -6% |
| Edinburgh, City of | 223 | 211 | 213 | 208 | 184 | 168 | 178 | -20% |
| Falkirk | 159 | 159 | 173 | 187 | 200 | 246 | 286 | 79% |
| Fife | 872 | 853 | 859 | 864 | 654 | 650 | 652 | -25% |
| Glasgow City | 1,305 | 1,239 | 1,196 | 1,171 | 1,145 | 1,111 | 1,069 | -18% |
| Highland | 1,455 | 1,455 | 1,382 | 1,373 | 1,342 | 1,342 | 1,342 | -8% |
| Inverclyde | 123 | 141 | 149 | 146 | 163 | 160 | 156 | 26% |
| Loch Lomond & the Trossachs | 35 | 32 | 31 | 31 | 28 | 28 | 28 | n/a |
| Midlothian | 272 | 271 | 270 | 216 | 197 | 189 | 118 | -57% |
| Moray | 19 | 17 | 22 | 21 | 15 | 15 | 15 | -19% |
| Na h-Eileanan Siar | 10 | 10 | 10 | 10 | 10 | 9 | 9 | -11% |
| North Ayrshire | 1,353 | 1,344 | 1,338 | 1,345 | 1,335 | 1,330 | 1,335 | -1% |
| North Lanarkshire | 1,419 | 1,373 | 1,303 | 1,297 | 1,262 | 1,226 | 1,282 | -10% |
| Orkney Islands | 41 | 41 | 39 | 39 | 39 | 39 | 39 | -6% |
| Perth & Kinross | 50 | 50 | 53 | 56 | 56 | 49 | 42 | -16% |
| Renfrewshire | 956 | 981 | 957 | 927 | 913 | 860 | 272 | -72% |
| Scottish Borders | 84 | 86 | 82 | 76 | 75 | 75 | 70 | -16% |
| Shetland Islands | 9 | 8 | 8 | 7 | 6 | 6 | 7 | -21% |
| South Ayrshire | 97 | 97 | 102 | 101 | 107 | 106 | 105 | 8% |
| South Lanarkshire | 476 | 470 | 475 | 472 | 461 | 411 | 422 | -11% |
| Stirling | 175 | 177 | 175 | 164 | 163 | 152 | 148 | -15% |
| West Dunbartonshire | 194 | 193 | 188 | 189 | 182 | 171 | 165 | -15% |
| West Lothian | 478 | 478 | 478 | 484 | 413 | 413 | 413 | -14% |
| Scotland | 11,391 | 11,256 | 11,100 | 13,192 | 12,744 | 12,493 | 11,649 | 2% |
Five local authorities contain almost two thirds of all recorded urban vacant and derelict land in Scotland. East Ayrshire has the largest amount with 2,401 hectares (21% of the Scotland total), Highland has the second largest amount with 1,342 hectares (12%), North Ayrshire is third with 1,335 hectares (11%), followed by North Lanarkshire with 1,282 hectares (11%) then Glasgow City with 1,069 hectares (9%). For those sites across Scotland where the previous use is known, 38% of derelict land recorded in 2017 had been previously used for mineral activity (3,559 hectares), 21% for manufacturing (1,922 hectares), and a further 14% for defence (1,260 hectares). For urban vacant land, the largest area was previously in residential use (17%, 302 hectares) and the second largest area had a previous use for agriculture (16%, 279 hectares).
The change in the recorded amount of urban vacant and derelict land during 2011 to 2017 varies by local authority. 24 local authorities had decreases in levels of recorded urban vacant and derelict land, including Renfrewshire (down 72%), Midlothian (down 57%) and Dumfries and Galloway (down 35%). Eight local authorities recorded more urban vacant and derelict land in 2017 than they did in 2011, including East Ayrshire, Clackmannanshire and Argyll and Bute.
The legacy of Scotland’s industrial past means that in 2017 almost a third of Scotland’s population lived within 500 metres of a derelict site. This varies by local authority area from 1.0% in Orkney to 61.7% in Glasgow and 75.8% in North Lanarkshire. 59% of people living in the most deprived areas (identified by the ‘Scottish Index of Multiple Deprivation’) in Scotland are estimated to live within 500 metres of derelict land, compared to 12% of people in the least deprived areas. In 2017, Glasgow City had the largest amount of urban vacant and derelict land located within the 15% most deprived areas.
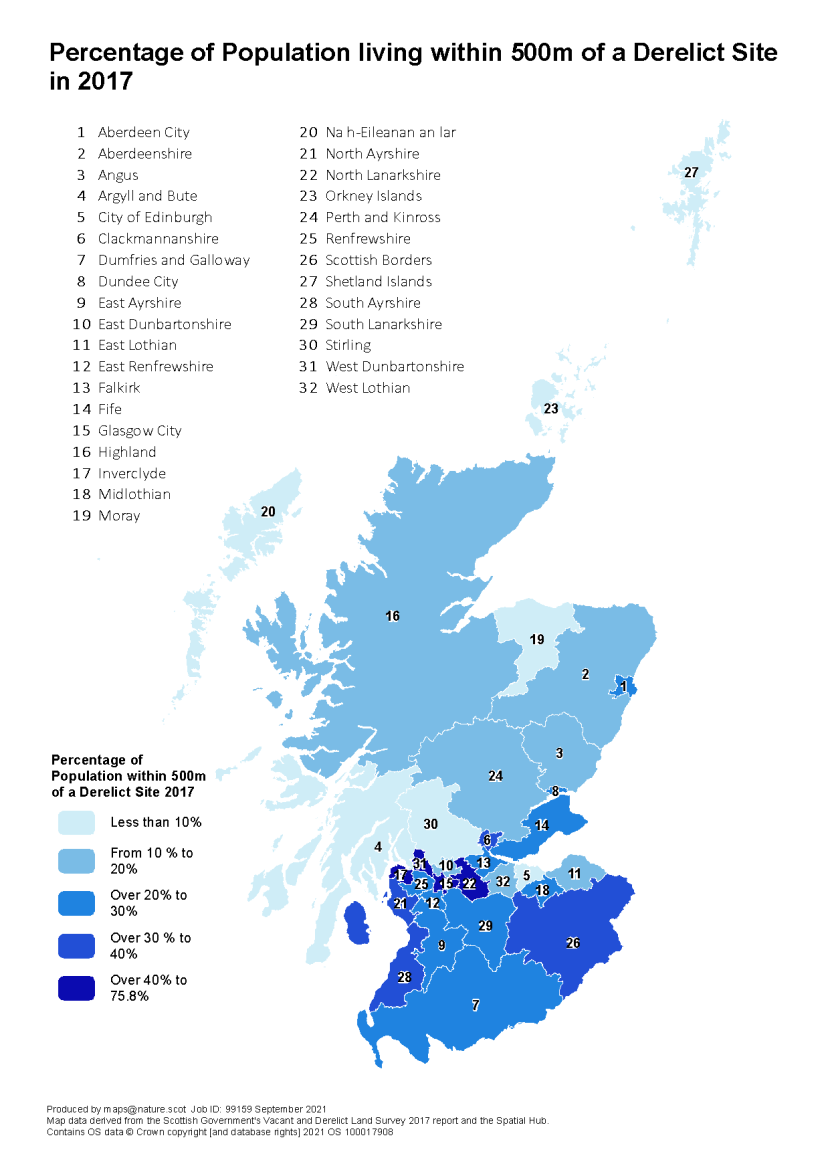
Percentage of population, per local authority, living within 500m of a derelict site in 2017
Click for a full description
Map of Scotland showing local authority boundaries. Each local authority is colour coded depending on the percentage of its population living within 500m of a derelict site. There are five percentage ranges that are colour coded, less than 10%, from 10% to 20%, from 20% to 30%, from 30% to 40% and 40% or more.
The statistics from the SVDLS are used by the Scottish Government to help allocate and monitor the impact of the Vacant and Derelict Land Fund. Since its inception in 2005/06, the Fund has contributed (either fully or partially) to the reuse of 386 hectares of previously urban vacant and derelict land across Dundee City, Glasgow City, Highland, North Lanarkshire, South Lanarkshire and Fife. Overall, 51% of all residential properties within 500 metres of land reclaimed using the programme were situated within Scotland's 15% most deprived areas. The Vacant and Derelict Land Taskforce continues its collaborative work with local authorities to transform vacant and derelict land back into productive use. Its reports to the Scottish Government are available on its website.
The DUSTE map is a useful resource to proactively identify opportunities to reuse long-term, derelict urban sites. A community-led action on vacant and derelict land guide is available to bring unloved places back into use in collaboration with local communities.
Source data and updates
This Indicator uses the SVDLS data directly from the Scottish Government and the Spatial Hub. The Indicator will be updated next in 2023.
UK indicators
There is no directly comparable UK indicator. The National Land Use Database (NLUD) classifies land use in England. HMRC will accept the NLUD as evidence as to whether land is derelict. In Wales, each Local Planning Authority reports on vacant and derelict land in their Annual Monitoring Reports.
Built Development - LBD1 & LBD2
Viewing these indicators below will take you to archived versions.
Document downloads
Disclaimer: Scottish Natural Heritage (SNH) has changed its name to NatureScot as of the 24th August 2020.
At the time of publishing, this document may still refer to Scottish Natural Heritage (SNH) and include the original branding. It may also contain broken links to the old domain.
If you have any issues accessing this document please contact us via our feedback form.
Last updated: