Assessing impacts to pink-footed and greylag geese from small-scale wind farms in Scotland
March 2025
Background & Purpose
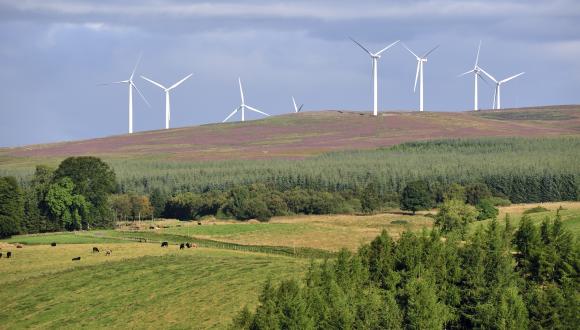
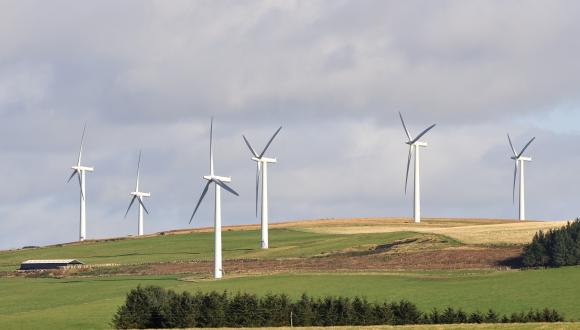
The purpose of this guidance is to set out a common approach to assessing the effects of small-scale wind farms on migratory greylag and pink-footed geese in Scotland, where they are connected with Special Protection Areas (SPAs) for these species (i.e. within 20km).
Potential effects include:
- collision mortality;
- displacement from preferred feeding areas; and
- in extreme cases, possible barrier-type effects.
This guidance should be used to assess proposals that:
meet NatureScot’s definition of small-scale wind energy; this is groups of three or fewer wind turbines with an output greater than 50kW
and
- will install turbines with a maximum blade-tip height of 150m.
The guidance should be used in conjunction with other published NatureScot guidance:
- Bird Survey Guidance for Onshore Wind Farms
- Assessing the cumulative impact of onshore wind farm developments
- Guidance on assessing connectivity with Special Protection Areas (SPAs)
- Assessing the impact of small-scale wind energy proposals on the natural heritage
- Guidance on using an updated collision risk model to assess bird collision risk at onshore wind farms
This document replaces the previous February 2014 version with minor text revision.
Collision mortality
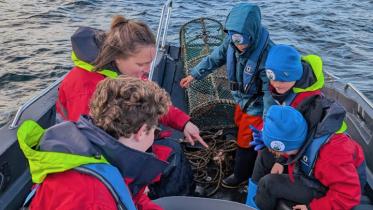
Both wintering greylag and pink-footed geese are normally listed as 'target species' during vantage point (VP) surveys which are carried out to quantify bird activity around wind farm proposals in eastern and southern Scotland. Our migratory wintering populations often result in large numbers of these birds being recorded in flight around proposed wind farm sites, raising concerns about the potential for high levels of collision mortality. However, a range of evidence from Europe and America suggests that the frequency of goose collisions at wind farms is low (review in Rees 2012), and NatureScot recommend an avoidance rate of 99.8% for all goose species (see Use of Avoidance Rates in the NatureScot Wind Farm Collision Risk Model).
Analyses of VP surveys found a reduction in goose flight activity with increasing distance from roosts (Patterson 2013; 2015). This work also confirmed that there can be considerable between-year variability in levels of flight activity at the same site. Importantly, there can also be large differences in the frequency of flights in neighbouring sites within the same year. This document presents a simple and streamlined method, commissioned from Ian Patterson, of assessing the number of goose collisions per year. The method uses these previous studies as a basis to estimate the number of collisions expected on average over the 25-year life of a small-scale wind energy development (Appendix 1), without the need for bespoke VP surveys. Table 1 sets out several critical assumptions associated with this method.
The following information is used:
- The distribution of feeding areas for greylag and pink-footed geese in Scotland;
- Knowledge of the flight behaviour of these species near roosts and feeding areas;
- The relationship between flight density and roost distance, as derived from multiple data sets, to predict the average number of goose encounters with turbines per year.
The only data required to calculate the encounter rate are:
- the distance from the proposed wind farm to the nearest SPA designated for greylag or pink-footed geese;
- the rotor radius of the proposed turbines; and
- the number of proposed turbines.
| Assumption | Comments |
|---|---|
1. Mean flight activity for all sites at any given distance from an SPA roost will be a reasonable estimate of mean flight activity at any one site over the 25 year operational life of a wind farm.
|
|
| 2. Birds in flight very close to roosts are likely to occur at particularly high densities. |
|
3. All birds in flight within 1.5km of an SPA boundary will be at collision risk height. 4. All birds in flight within 1km squares used regularly for foraging (Mitchell, 2012), and within 1.5km of such squares, will be at collision risk height. |
|
5. No birds more than 1.5km from an SPA boundary, and more than 1.5km from foraging areas as defined above, will be at collision risk height
|
|
Small scale wind farm sites may therefore be placed into one of three categories regarding collision risk to geese:
- High risk: sites less than 1.5km from SPA boundaries. These sites are likely to be associated with particularly high densities of birds at collision risk height. A programme of dedicated VP watches will normally be required to estimate collision mortality.
- Moderate risk: sites more than 1.5km from SPA boundaries, but within 1.5km of feeding areas as defined by Mitchell (2012). The numbers of geese in flight are likely to be variable but may be substantial in some years. Most birds will be at collision risk height. A generic collision risk calculation should be carried out in line with Appendix 1 and its accompanying spreadsheet.
- Low risk: sites more than 1.5km from SPA roosts and away from regularly used foraging areas. Almost all geese will be above collision risk height, and goose collisions at these sites are expected to be very rare.
Displacement
Displacement occurs when birds avoid areas around wind farms, thereby losing access to foraging sites. Pink-footed geese are known to partially habituate to the presence of a wind farm over c.10 years but can continue to be displaced for longer; in the worst cases, this can include the entire turbine envelope plus a zone of 100m around it (Madsen & Boertmann 2008). This is an important consideration because habitat quality during the non-breeding season can affect the body condition of geese and their departure dates in spring, both of which can, in turn, affect breeding success (Ebbinge & Spaans 1995; Madsen 1995).
The total extent of foraging areas available to grey geese at SPAs in Scotland is only understood at a few sites. However, it is generally considered that 20km is the normal maximum foraging geese fly to and from roosts (Michell 2012), so typically the total potential foraging area is very large. This suggests that the loss of foraging area around an individual small-scale wind farm is likely to be extremely small, in comparison with the extent of the entire resource (Appendix 2).
A wind farm may be proposed for land where the habitat is completely unsuitable for foraging grey geese, and displacement effects may be confidently ruled out. Conversely, there are rare circumstances under which displacement may require more detailed consideration, for example:
- in known foraging areas near SPAs at which the total foraging resource is geographically localised or where geese are particularly constrained by disturbance or other factors; and/or
- in the case of applications where the land was previously managed to be attractive to geese, for example though a goose management scheme.
Barrier effects
Direct observations and radar studies at large marine wind farms indicate that geese in flight prefer to avoid the entire turbine envelope, either by gaining height to pass over the turbines or by altering course to fly around them (Plonczkier & Simms 2012). There is less evidence onshore, although a recent study in Denmark showed vertical and horizontal avoidance behaviour in large-bodied birds (including geese) to large turbines (Therkildsen et al. 2021). Therefore, the potential exists for badly-sited proposals to cause barrier effects, by increasing the energetic costs of geese forced to alter their preferred flight paths.
Within 1.5km of an SPA boundary, where birds are more likely to be flying at collision risk height, it is important to establish whether preferred flight lines are likely to be affected. Information on this may be available from local observations of goose feeding areas and flights. If such information is unavailable it will normally be necessary to commission dedicated VP work to inform the issue. However, any such decisions on fieldwork should be made on a case-by-case basis, using any existing information on flight lines, feeding areas and proximity to main roosting areas within an SPA. The size and layout of the proposed turbines should also be considered; for example, a line of three turbines perpendicular to a flight line is a more serious potential barrier than three turbines arranged parallel to the preferred direction of flight.
Summary of recommendations
A Habitat Regulations Appraisal (HRA) is required where a plan or project could affect an SPA. Table 2 considers those circumstances under which a small-scale wind farm proposal is considered to have a likely significant effect on an SPA designated for greylag or pink-footed geese.
| Effect | Recommendations |
|---|---|
| Collision |
|
| Displacement |
|
| Barrier effects |
|
References and Appendices
References
Ebbinge, B.S. & Spaans, B. 1995. The importance of body reserves accumulated in spring staging areas in the temperate zone for breeding in Dark-bellied Brent Geese in the high Arctic. Journal of Avian Biology 26: 105-113. https://doi.org/10.2307/3677058
Ecology Consulting. 2012. Hellrigg Wind Farm: Goose Refuge Monitoring Report. Winter 2011-12. Ecology Consulting Report to RWE Npower Renewables, Ecology Consulting, Old Cassop, Durham.
Madsen, J. 1995. Impacts of disturbance on migratory waterfowl. Ibis 137: 67-74. https://doi.org/10.1111/j.1474-919X.1995.tb08459.x
Madsen, J. & Boertmann, D. 2008. Animal behavioural adaptation to changing landscapes: spring-staging geese habituate to wind farms. Landscape Ecology 23: 1007-1011. https://doi.org/10.1007/s10980-008-9269-9
Mitchell, C. 2012. Mapping the distribution of feeding Pink-footed and Iceland Greylag Geese in Scotland. Wildfowl & Wetlands Trust / Scottish Natural Heritage Report, Slimbridge.
Patterson, I.J. 2013. Goose distribution in relation to SPAs in Grampian. Scottish Natural Heritage Commissioned Report No. 546. https://www.nature.scot/doc/naturescot-commissioned-report-546-goose-distribution-relation-spas-grampian
Patterson, I.J. 2015. Goose flight activity in relation to distance from SPAs in Scotland, including an analysis of flight height distribution. Scottish Natural Heritage Commissioned Report No. 735. https://www.nature.scot/doc/naturescot-commissioned-report-735-goose-flight-activity-relation-distance-spas-scotland-including
Plonczkier, P. & Simms, I.C. 2012. Radar monitoring of migrating pink-footed geese: behavioural responses to offshore wind farm development. Journal of Applied Ecology, 49, 1187-1194. https://doi.org/10.1111/j.1365-2664.2012.02181.x
Rees, E.C. 2012. Impacts of wind farms on swans and geese: a review. Wildfowl 62: 37-72.
Therkildsen, O.R., Balsby, T.J.S., Kjeldsen, J.P., Nielsen, R.D., Bladt, J. & Fox, A.D. 2021. Changes in flight paths of large-bodied birds after construction of large terrestrial wind turbines. Journal of Environmental Management 290: 112647. https://doi.org/10.1016/j.jenvman.2021.112647
Appendix 1. Estimating collision mortality from wind farm size and distance from nearest SPA roost
Reviews of goose flight rates at different sites (Patterson 2013, 2015) included VP survey areas of different shapes and sizes. There were also differences in the extent to which survey methods were described. To allow comparisons between sites, Patterson derived a standard measure of flight activity based on the total number of geese flying over a nominal survey area of 1km2 per hour of VP observation. The data used were all from VP surveys covering the whole season of goose occurrence in Scotland, although limitations in many of the original datasets meant that the observations could not be corrected for any differences in survey effort that may have occurred between months.
Figure 1 shows the relationship between goose flight activity and distance to the nearest SPA designated for pink-footed or greylag geese, measuring between the centre of each wind farm site and the proximal boundary of the nearest SPA (for wind farm sites at altitudes up to 200m and for geese flying at heights of 0-150m above local ground level). Only sites from north-east Scotland are included; however, analysis of a small sample elsewhere in Scotland suggests that rates of goose flight activity below 200m in other areas are comparable with those found in the north-east (Patterson 2015).
Table 3 summarizes these same data for each of three distance bands. The mean levels of flight activity set out in Table 3 are then used in the accompanying spreadsheet to estimate the number of goose collisions per year that would be expected, on average, over the 25-year life of a wind farm. The 20-40.6km band is included to indicate the 'background' level of flight activity that may originate from birds using non-SPA goose roosts; NatureScot's recommendation is that wintering pink-footed and greylag geese observed over 20km from an SPA are unlikely to be connected to it.
A spreadsheet has been provided to calculate the following:
- The frontal area of the risk window at one turbine (i.e. the height of the turbine x ((2 x the turbine blade length) + 400m)
- The proportion of the risk window occupied by the rotor disc
- The mean number of geese per km2 passing over the site per hour, given from the regression of goose flight activity in relation to distance from the roost
- The area of risk around the turbine (a circle of radius 200m plus blade length)
- The number of goose active hours, taken as the mid-September to mid-April total of sunrise to sunset hours, plus 1 hour at dawn and dusk and 25% of night-time hours
- The number of geese passing through the risk window and through the rotor
- The predicted number of collision casualties per turbine, without avoidance and with avoidance. For simplicity, the calculation uses a generic value of 0.1 as the probability of collision from the Band model (see Guidance on using an updated collision risk model to assess bird collision risk at onshore wind farms)
- The predicted total number of collision casualties for all the turbines
The details of each step of the calculation can be seen by clicking on the appropriate cell in the spreadsheet.
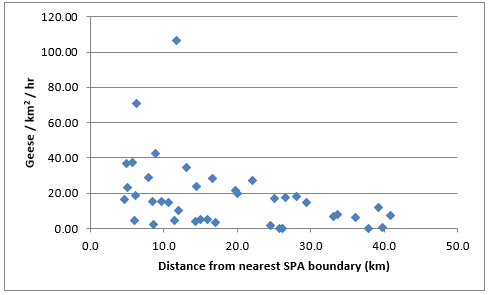
Figure 1. Goose flight activity (number of geese per km2 per hour) at 0 to 150m above local ground level, in relation to distance from the nearest SPA designated for pink-footed or greylag geese. Data are from 47 sites in NE Scotland under 200m altitude.
Click for a full description
Graph showing goose flight activity (per km2 per hour), plotted against distance from the nearest SPA boundary in km. Flight activity is generally around 40 geese/km2/hr or below at around 10km from the SPA, and decreases to less than 20 geese/km2/hr at 40km.
| Distance from nearest SPA boundary | Mean rate of goose flight activity (birds / km2 / hr) | Number of sites |
|---|---|---|
| 4.6 - 10 | 26.03 | 12 |
| 10 - 20 | 21.65 | 14 |
| 20 - 40.6 | 9.11 | 16 |
Appendix 2. Comparing the loss of foraging area through displacement to the total area available
This is a simplified, hypothetical example using precautionary assumptions to illustrate the maximum displacement effect for a small-scale wind farm in a landscape used extensively by foraging geese.
- Suppose geese roost on a coastal SPA and utilize areas within 10km of the roost for foraging. Fields suitable for foraging geese are distributed evenly across an area which approximates to a semicircle, and all such fields are equally attractive to geese irrespective of their distance from the roost. In total 20% of the land area within 10km of the roost contains suitable fields.
Total foraging area available to geese = 0.2 x (area of semicircle)
= 0.2 x 0.5 x π x 10 x 10
= 31.4km2
- A small-scale wind farm is proposed within a field used by foraging geese. The turbines are equally spaced on the circumference of a circle of radius 50m.
Total potential habitat loss through displacement
= (wind farm envelope) + (100m buffer)
= π x 150 x 150
= 70,650m2
= 0.071km2
- Proportion of foraging extent lost = 0.071/31.4 = 0.0023